
Ripple’s XRP has been consolidating within a narrow trading range for over the past month. The price action of this cryptocurrency is mostly contained between the $0.192 support level and the $0.212 resistance.
Throughout this stagnation phase, the Bollinger bands were forced to squeeze based on XRP’s 1-day chart. Squeezes are indicative of periods of low volatility and are typically succeeded by wild price movements.
The inability of this technical index to provide a clear path for XRP’s direction makes the area between the lower and upper band a reasonable no-trade zone.
XRP Consolidates Within No-Trade Zone. (Source: TradingView)
However, multiple on-chain metrics suggest that the cross border remittances tokens is about to break out of this zone.
Idled XRP Tokens Are On the Move
Santiment’s Token Age Consumed index registered a significant spike in idle XRP moving between addresses in the last few hours. This on-chain metric measures how many coins have recently changed hands, multiplied by the number of days since they last moved.
“Spikes in “Token Age Consumed” can signal changes in the behavior of some long-term holders, and tend to precede increased volatility for the coin’s price action,” according to the behavior analytics platform.
For over the past year, there has been a certain level correlation between old tokens changing hands and the price of this cryptocurrency.
In mid-July 2019, for instance, XRP took a 30% nosedive after Santiment recorded a considerable amount of idled tokens moving between addresses. Later that year, the international settlements token plummeted another 42% when the ratio of old tokens changing hands began to increase.
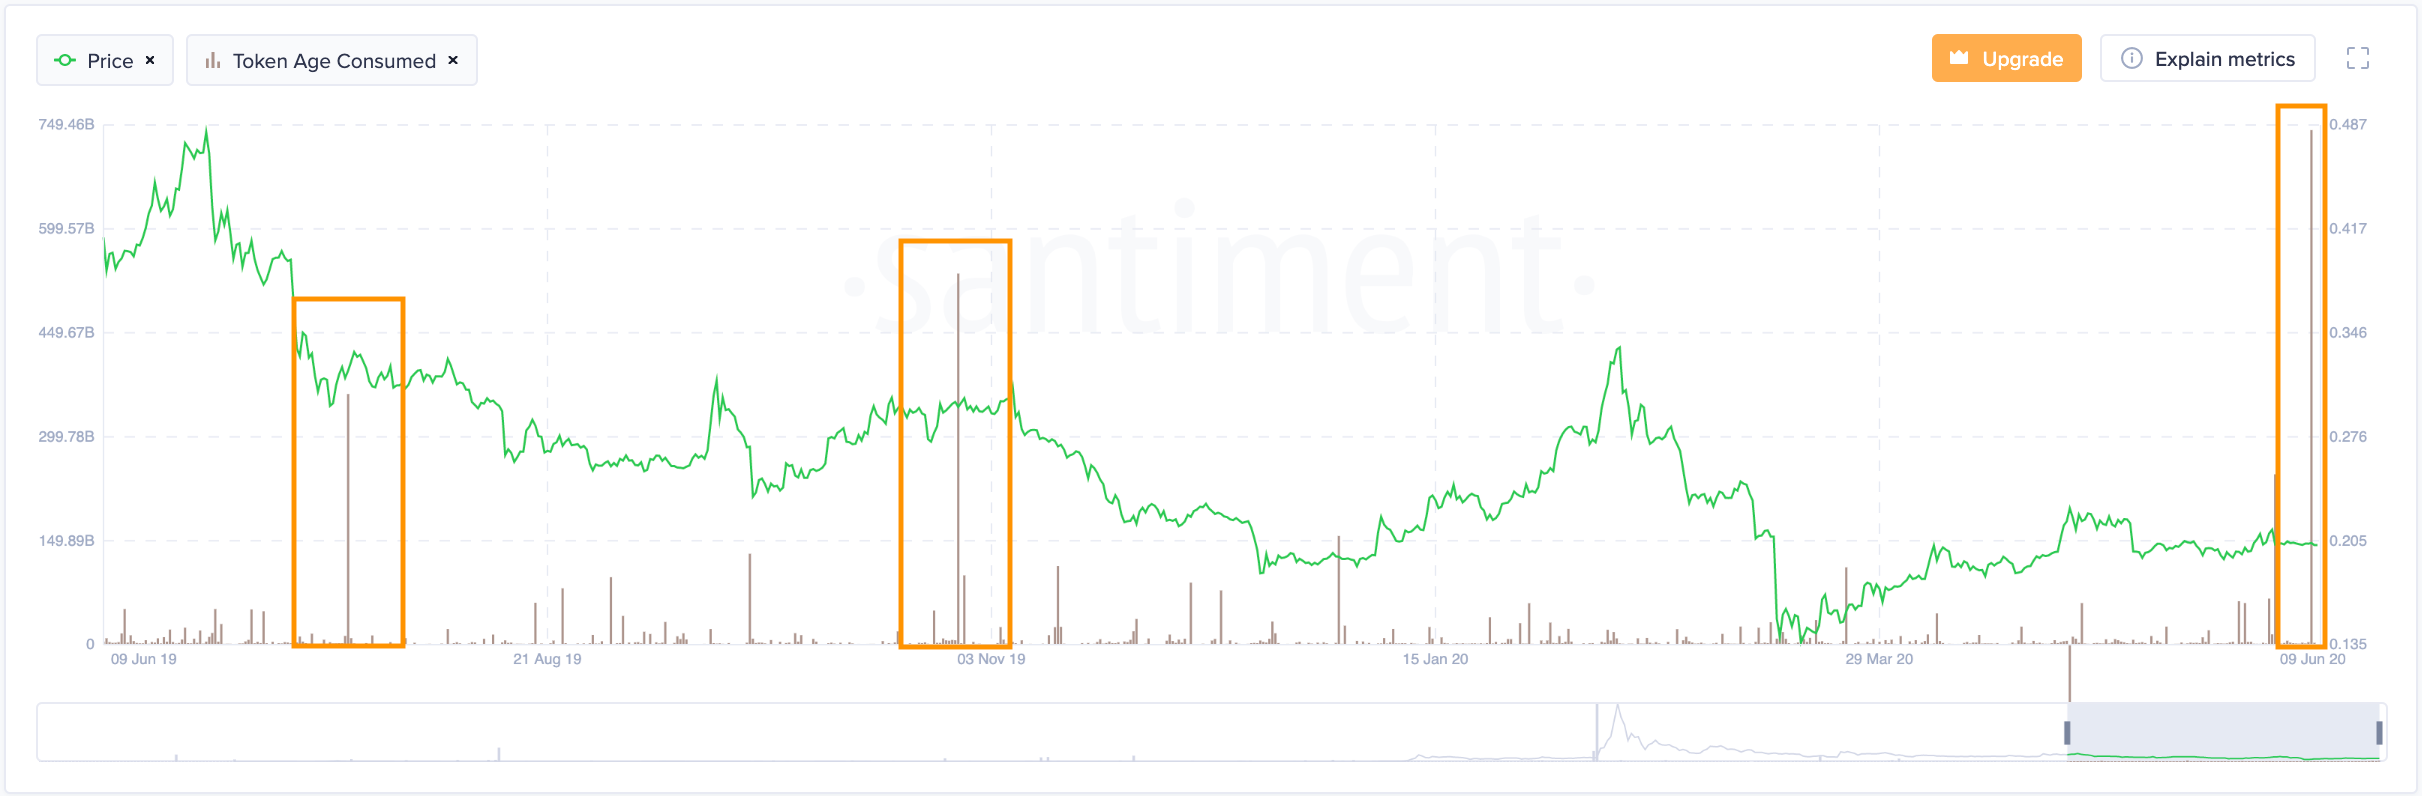
Massive Spikes In Token Age Consumed. (Source: Santiment)
Now that over 1 billion idled XRP are on the move, history could be about to repeat itself suggesting a downward impulse on the horizon.
The steady decline in on-chain volume since the peak of April 30 when XRP went up to $0.236, adds credence to the pessimistic outlook. Such divergence between price and volume represents a negative sign that indicates that momentum for a bearish impulse is building up slowly.
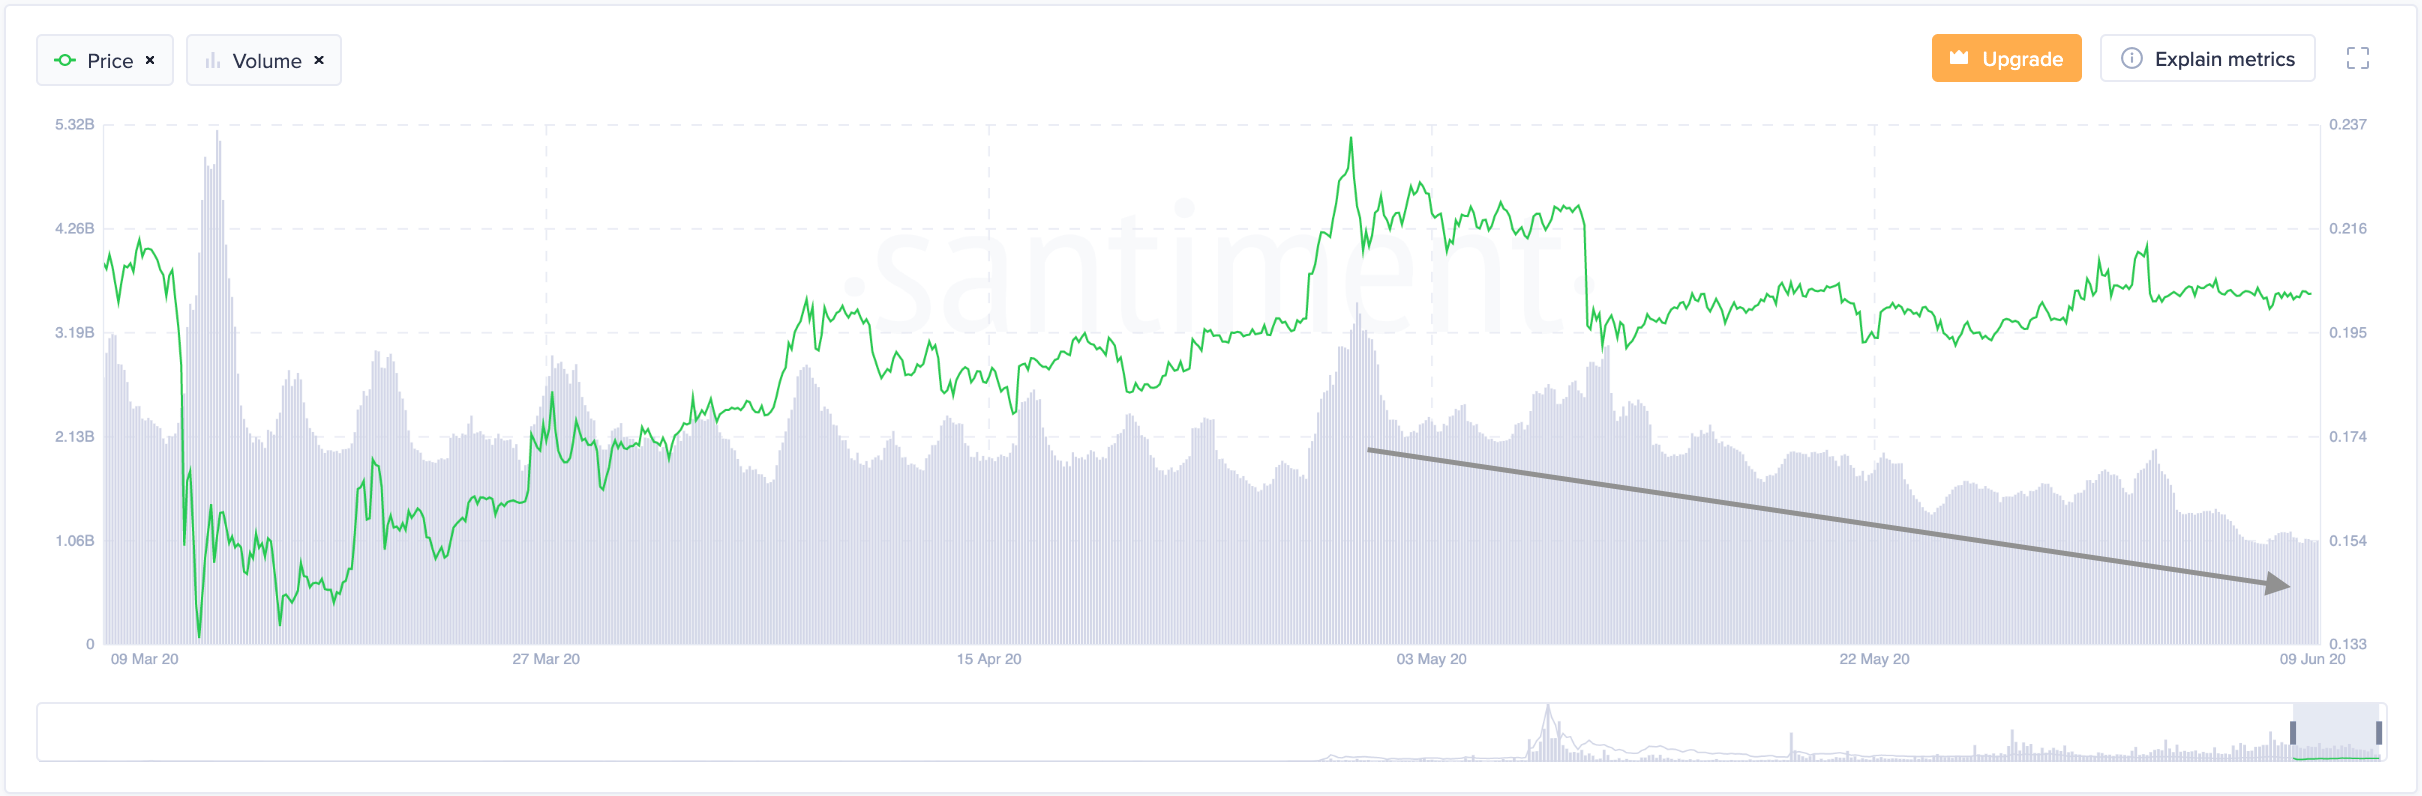
XRP On-Chain Volume Declines. (Source: Santiment)
But before jumping into any side of the trend, one must wait for either support or resistance to break first.
An Ambiguous Outlook
A spike in the selling pressure behind XRP that allows it to break below support may have the potential to ignite a major sell-off. Under such circumstances, the next supply barriers to watch out for are the 50% and 61.8% Fibonacci retracement levels.
These areas of support sit at $0.173 and $0.158, respectively.
On the flip side, an increase in demand that is able to push the price of the Ripple’s native token above the $0.212 resistance level might jeopardize the bearish outlook. If this were to happen, it is reasonable to expect a retest of late April’s high of $0.236.
Now, it is just a matter of time before support or resistance breaks first to help determine where XRP is headed next.