Key Highlights:
- Bitcoin price is facing $5,299;
- the Bulls were fully in control of the BTC market;
- the pullback is inevitable.
BTC/USD Medium-term Trend: Bullish
Resistance levels: $5,299, $5,574, $5,840
Support levels: $4,988, $4,742, $4,491
BTC/USD is on the bullish trend on the Medium-term outlook. As it was predicted last week, BTC/USD broke through several resistance levels with strong momentum of the bulls and our last week target was reached.
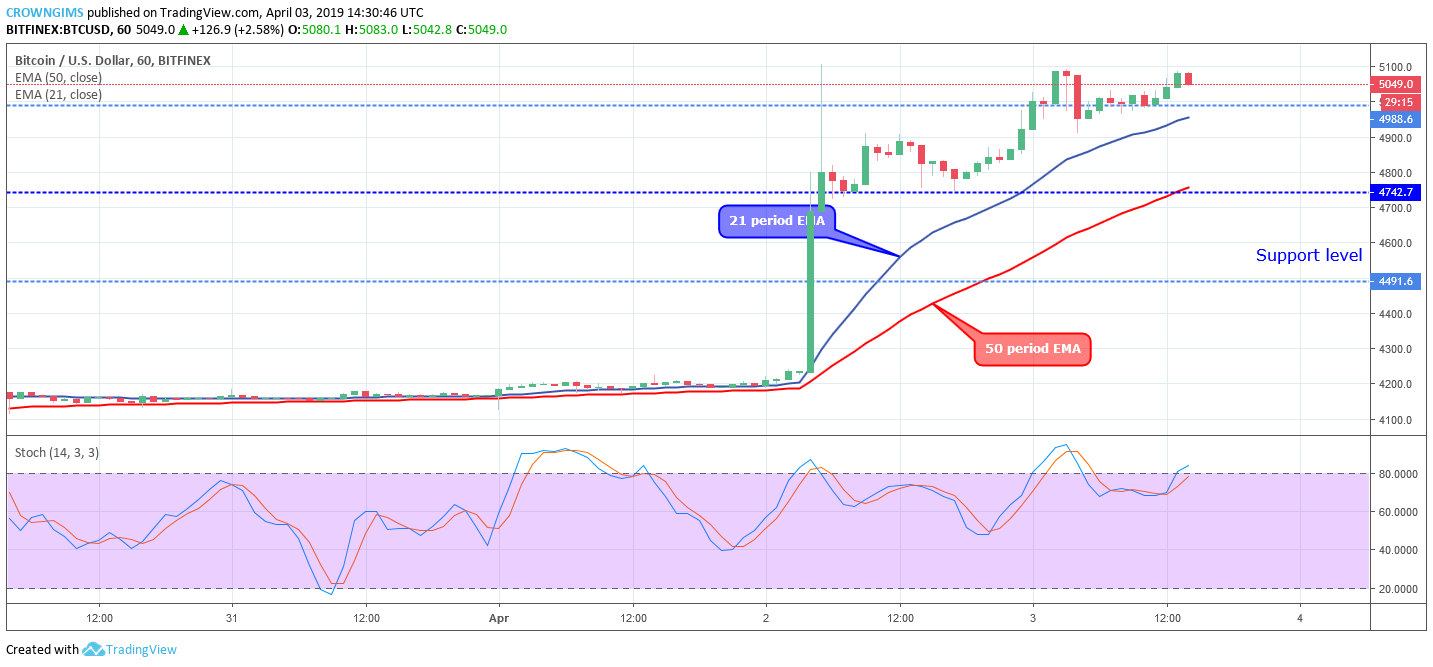
The momentum of the Bulls and the Bear were on the same level for several days until April 2 when the strong and massive bullish candle emerged that broke up the former resistance levels of $4,491, $4,742, $4,988. The pullback was observed and there is a possibility for the uptrend to continue.
The coin is far above the two EMAs and the 21 periods EMA remains above the 50 periods EMA with the two EMAs fanned apart to indicate increased bullish pressure in the BTC market.
The Stochastic oscillator period 14 is above 80 levels with the signal line pointing upside to indicate buy signal and a further increase in Bitcoin price. The Bulls may still push the BTC price up towards $5,299 in case the Bulls sustain its momentum though pullback is inevitable.
BTC/USD Short-term Trend: Bullish
BTC/USD is also on the bullish trend on the short-term outlook. The Bulls increased their momentum and the coin rallied sporadically to the north broke up former resistance levels such as $4,491, $4,742, $4,988. Currently, the coin is above $4,988 facing $5,299. There is a tendency for a further increase in Bitcoin price as the two EMAs are facing up.
The BTC price is trading above the two EMAs and the 21 periods EMA has crossed the 50 period EMA upside. The Stochastic Oscillator period 14 is at 80 levels with the signal lines pointing upside to indicate buy signal and a further increase in Bitcoin price. Traders can look for an opportunity to place buy setup when the BTC pullback.


