View
- Bitcoin is looking north, having closed above the 21-month exponential moving average (EMA) on April 30. Forcing a quick rally to $6,000, however, may be difficult for the bulls, as a number of key resistance levels are lined up in the $5,400–$5,900 range.
- The short-term outlook will remain bullish as long as the price is holding above the 30-day MA at $5,199. Bitcoin, however, risks falling back to that level in the next 24-hours, according to the short duration charts.
- A close below the 30-day MA would boost the odds of a head-and-shoulders breakdown and a slide to the 50-day moving average, currently at $4,736.
Bitcoin (BTC) is on the offensive, having defended key support, but a rally to $6,000 faces a number of resistance hurdles lined up in the $5,400–$5,900 range.
The leading cryptocurrency by market capitalization fell more than 5 percent to $5,000 on April 25 after the New York Attorney General’s office alleged that Bitfinex had lost $850 million and used a secret loan from affiliated firm Tether to hide the loss.
The price pullback, however, was short-lived. BTC again bounced up from the crucial 30-day moving average (MA) resistance on April 30 and is currently trading at $5,350 on Bitstamp.
Additionally, BTC closed last month above the former support-turned-resistance of the 21-month exponential moving averages (EMA), solidifying the long-term bullish breakout, as discussed yesterday.
As a result, a consensus seems to have built in the market place that BTC will likely see a quick rise to $6,000 in the short-term.
While the outlook is indeed bullish, a sharp rally to $6,000 may not be so smooth with the following levels possibly offering stiff resistance.
Resistance 1: 50-week MA at $5,414
BTC is again closing on the (bearish) 50-week moving average (MA), currently at $5,414, which proved a tough nut to crack last week.
At the time, prices had risen to a five-month high of $5,627, but they ended the week well below the 50-week MA. Bitcoin’s failure to hold onto gains isn’t surprising as the average is still trending south, indicating a bearish setup.
It is often observed that averages serve as resistance if they are biased bearish (sloping downwards). A sustained breakout is more often seen once the average begins to flatten out.
It’s worth noting that rejection at the 50-week MA in July and August 2015 almost ended up killing the nascent bull market, as discussed last week.
Another failure to close above the 50-week MA could trigger profit taking, leading a deeper drop below $5,000.
Resistance 2: June 2018 bottom at $5,780
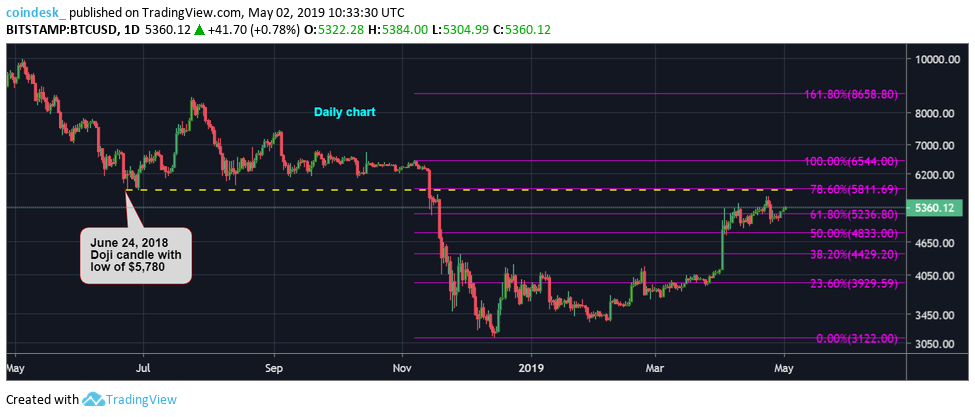
Bitcoin could face stiff resistance at $5,780, the level at which BTC’s sell-off from May 2018 highs near $10,000 bottomed out at the end of June. A bounce from $5,780 was followed by a more than 40 percent rally to $8,500 by July 24, further highlighting the importance of the price level.
As a result, the former support could now act as a stiff resistance, more so, as the 78.6 percent Fibonacci retracement of the sell-off from the November highs to December lows – one of the widely-tracked Fibonacci ratios – is located at nearby at $5,811.
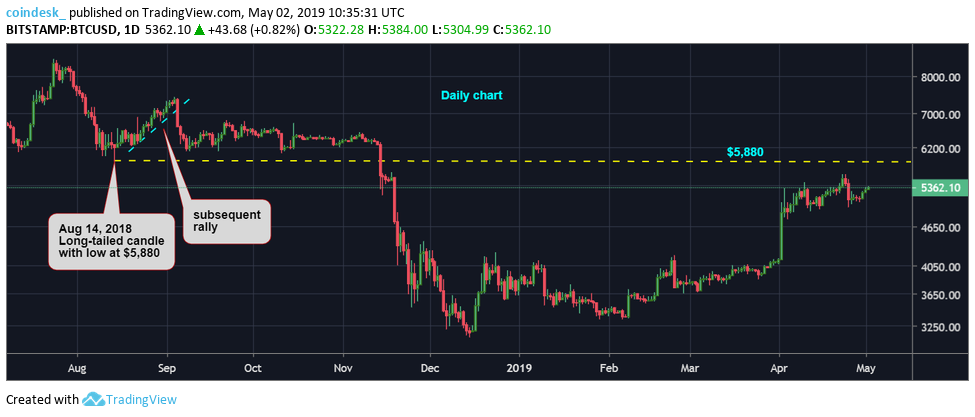
Resistance 3: August 2018 bottom at $5,880
Again, $5,880 is a former support-turned-resistance. It marks the low of the long-tailed candle created on Aug. 14, 2018, that aborted the sell-off from July highs. Similarly, the candle ended up fueling a significant price bounce to $7,411 (Sept. 4 high).
So, it seems safe to say that the road to $6,000 is packed with stiff resistance levels. Traders should watch out for signs of bullish exhaustion (candlestick patterns like doji, bearish engulfing, etc.) near the key hurdles, which could mark price pullbacks.
As for the next 24-hours, the focus remains on the 30-day moving average (MA), currently $5,199.
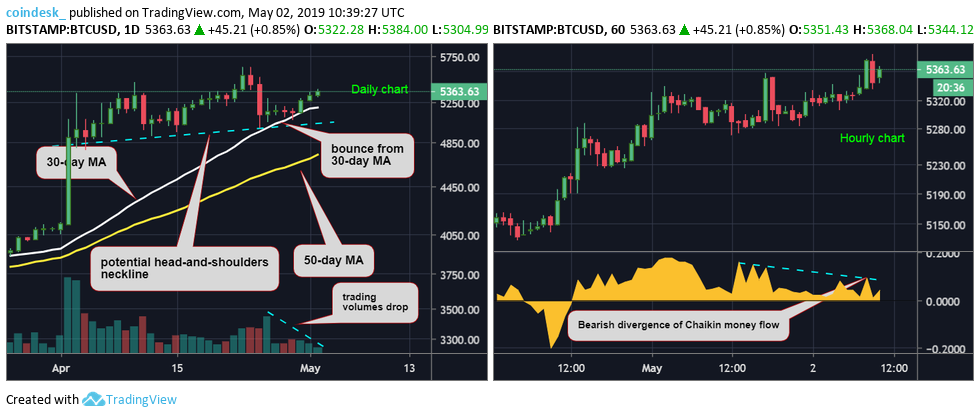
Daily and hourly chart
The chart shows (above left), the latest bounce from the 30-day MA is accompanied by falling volumes. Further, the hourly chart (right) is showing a bearish divergence of the Chaikin money flow indicator.
As a result, a fall back to $5,199 (30-day MA) looks likely. A close below that level would put the focus back on the bearish divergence of the relative strength index, confirmed last week. In that case, BTC would likely drop below $5,030, confirming a head-and-shoulders bearish reversal pattern and slide toward the 50-day MA, currently at $4,736.
The head-and-shoulders breakdown, however, would remain elusive if prices break above $5,466 (April 10 high), validating the recent bounce from the 30-day MA. In that case, April’s high of $5,627 could come into play.
Disclosure: The author holds no cryptocurrency assets at the time of writing.
Hurdles image via Shutterstock; charts by Trading View


