The current pullback has resolved the overbought state of many cryptocurrencies and after a few days of consolidation the uptrend is likely to resume.
After Bitcoin (BTC) scaled above $10,000 the mood among market participants turned hugely bullish. Daily talks of the asset making new highs blanketed crypto Twitter and this bullish sentiment also rubbed off on altcoins which picked up momentum and rallied sharply in the past few days. As the week approached a close it was clear that the crypto market was looking overheated in the short-term as greed gripped the market participants.
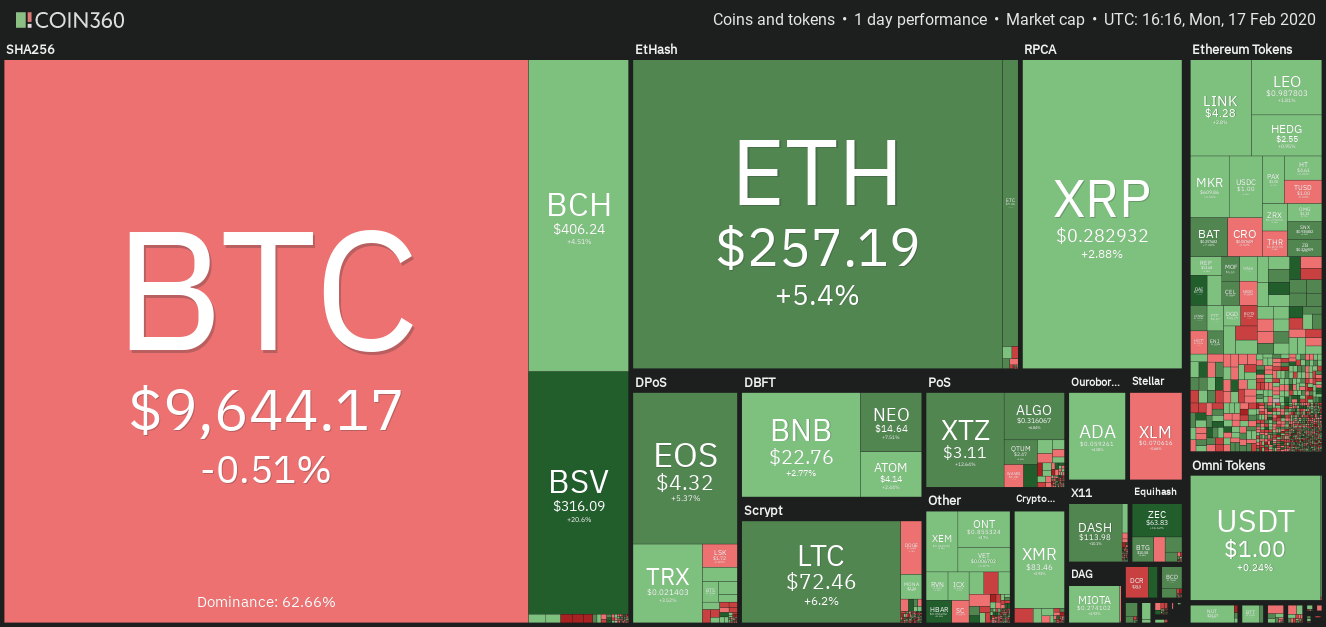
Such a situation usually results in a sharp pullback that scares the weak hands away. Led by Bitcoin, the crypto markets have slipped sharply in the past two days. The total crypto market capitalization that had surged to over $308 billion on Feb. 15 dropped to about $274 billion on Feb. 17. This shows profit booking by the short-term traders.
Daily cryptocurrency market performance. Source: Coin360
However, the long-term trend in most major cryptocurrencies remains intact. Therefore, we suggest traders view this current fall as a buying opportunity. Nonetheless, we recommend traders wait for the decline to end before jumping in.
The long-term Bitcoin bulls are unfazed by the current drop. Celebrated TV host Max Keiser has revised his target on Bitcoin from $100,000 to $400,000. Though we are also bullish in the long-term, let’s see what does the short-term project?
BTC/USD
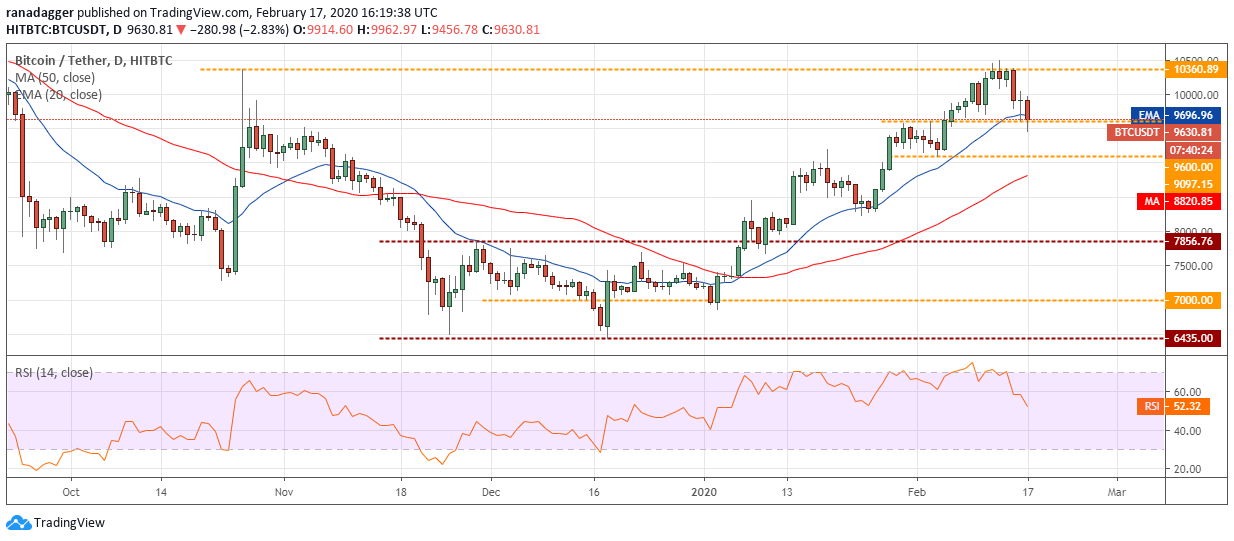
The failure to sustain above the overhead resistance at $10,360.89 has attracted profit booking by the short-term traders. Though Bitcoin (BTC) bounced off the 20-day EMA at $9,700 on Feb. 16, the bulls could not build up on the rebound. This shows selling at higher levels.
BTC USD daily chart. Source: Tradingview
Currently, the bears are attempting to sink the price below the 20-day EMA. If successful, the BTC/USD pair can drop to the next support at $9,097.15. We anticipate the bulls to defend this support aggressively.
The 20-day EMA is flattening out and the RSI has dipped close to the midpoint. This suggests a range-bound action in the near-term.
On the downside, a drop below the $9,097.15-$8,820 support zone will turn the trend in favor of the bears. For now, the traders can keep the stop loss on the remaining long positions at $8,900.
ETH/USD
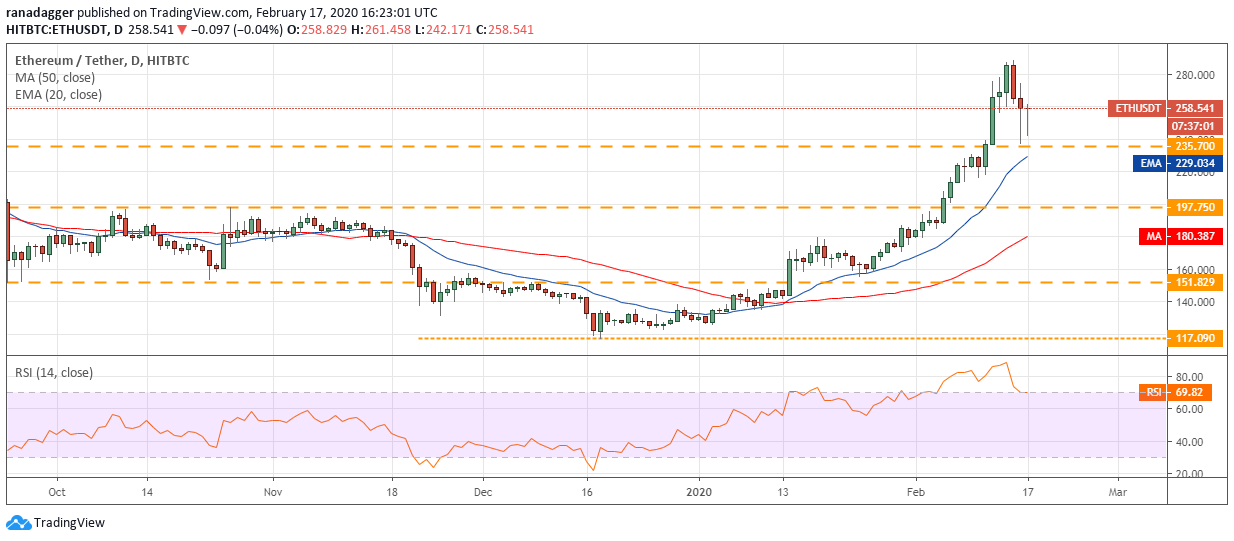
Ether (ETH) turned down from $288.599 on Feb. 15, which was very close to our first target objective of $289.221. The sharp pullback has dragged the price back to the breakout level of $235.70. Though the price rebounded sharply from $235.70 on Feb. 16, the bulls have not been able to build up on the bounce. This shows that sellers are active at higher levels.
ETH USD daily chart. Source: Tradingview
Currently, the bulls are again attempting to defend the support at $235.70. If successful, the ETH/USD pair might attempt to resume the up move. However, if the bears sink the price below $235.70, the 20-day EMA at $229 might act as a support.
A break below the 20-day EMA will be a negative sign and it can drag the price to the next support at $197.75. The traders can trail the stop loss on the remaining long positions to $220.
XRP/USD
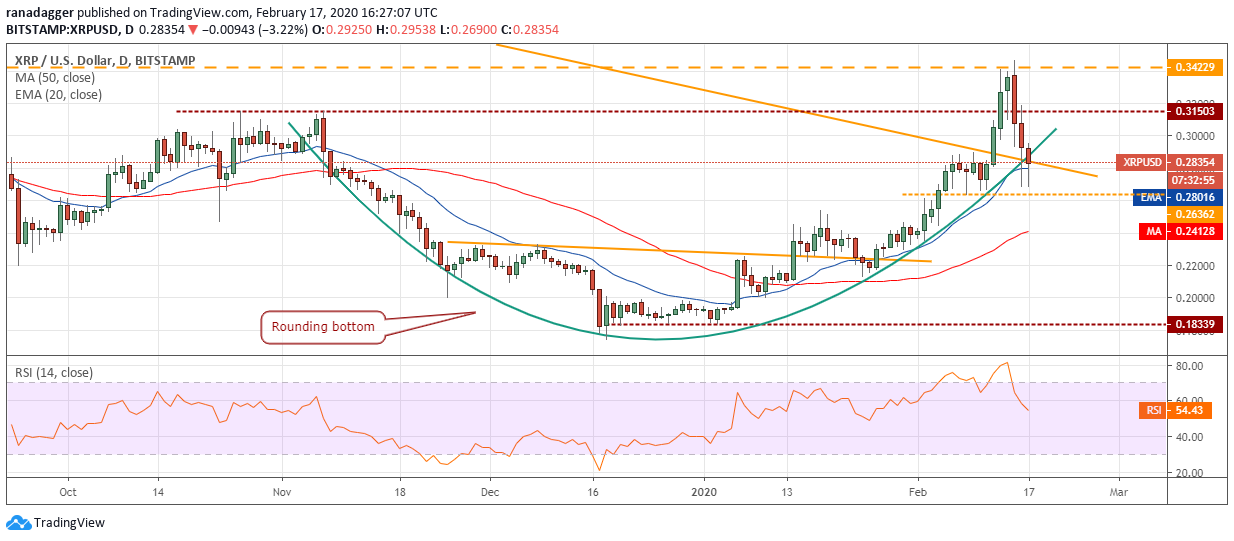
XRP could not sustain above the resistance at $0.34229 on Feb. 15. The failure to do so attracted profit booking that dragged the price below the 20-day EMA, which is a negative sign. If the bears sink the price below $0.26362, the drop can extend to the 50-day SMA.
XRP USD daily chart. Source: Tradingview
However, if the price stays above $0.26362, the bulls will again attempt to carry the price to $0.34229. We anticipate a few days of consolidation between $0.26362 and $0.34229 before the XRP/USD pair starts a trending move. For now, the traders can keep the stop loss on the long positions at $0.26.
BCH/USD
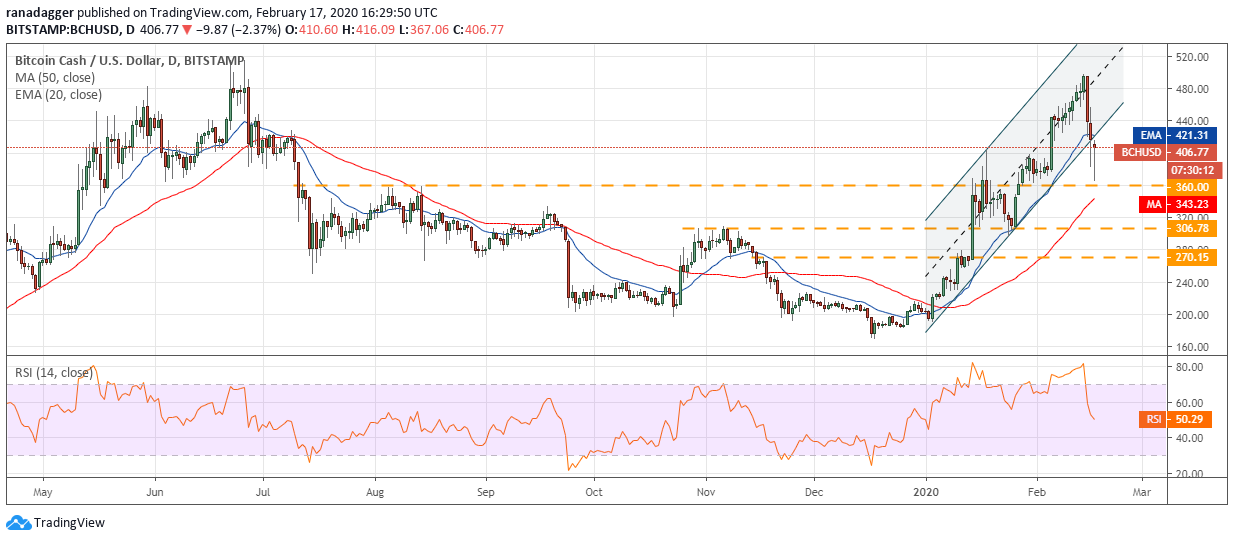
Bitcoin Cash (BCH) reversed direction from close to the stiff resistance at $500. The sharp correction dragged the price below the ascending channel. This breaks the uptrend that was in force.
BCH USD daily chart. Source: Tradingview
Currently, the bulls are attempting to hold the breakout level at $360. If this support holds, the BCH/USD pair might rise to the 20-day EMA, which might act as a resistance. After the volatile action of the past few days, we anticipate a few days of consolidation.
Our view will be negated if the bears sink the price below the support at $360 and the 50-day SMA at $343. If this support cracks the decline can extend to $306.78.
BSV/USD
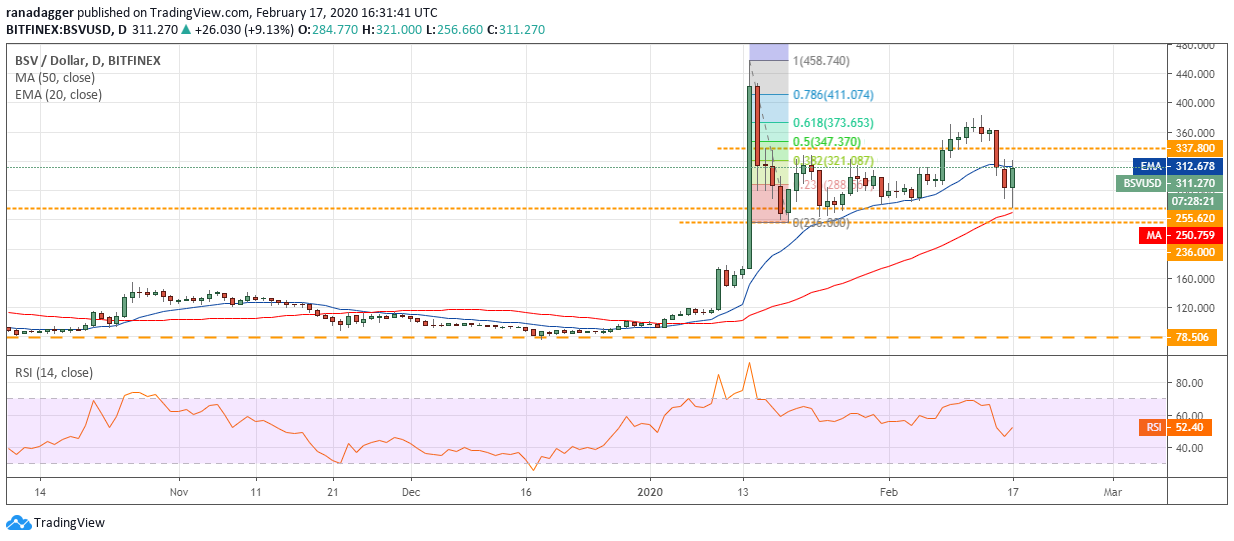
Bitcoin SV (BSV) dipped below the critical support at $337.80 on Feb. 15. This triggered further selling that dragged the price to the 50-day SMA at $243. Currently, the price has bounced off sharply from the 50-day SMA.
BSV USD daily chart. Source: Tradingview
If the price rises above the 20-day EMA, the next level to watch out for is $337.80. We anticipate a range-bound action between $236 and $337.8 for a few days.
Our view will be invalidated if the BSV/USD pair price turns down from the 20-day EMA and breaks below $236. Below this level, the next level to watch out for is $173.66.
LTC/USD
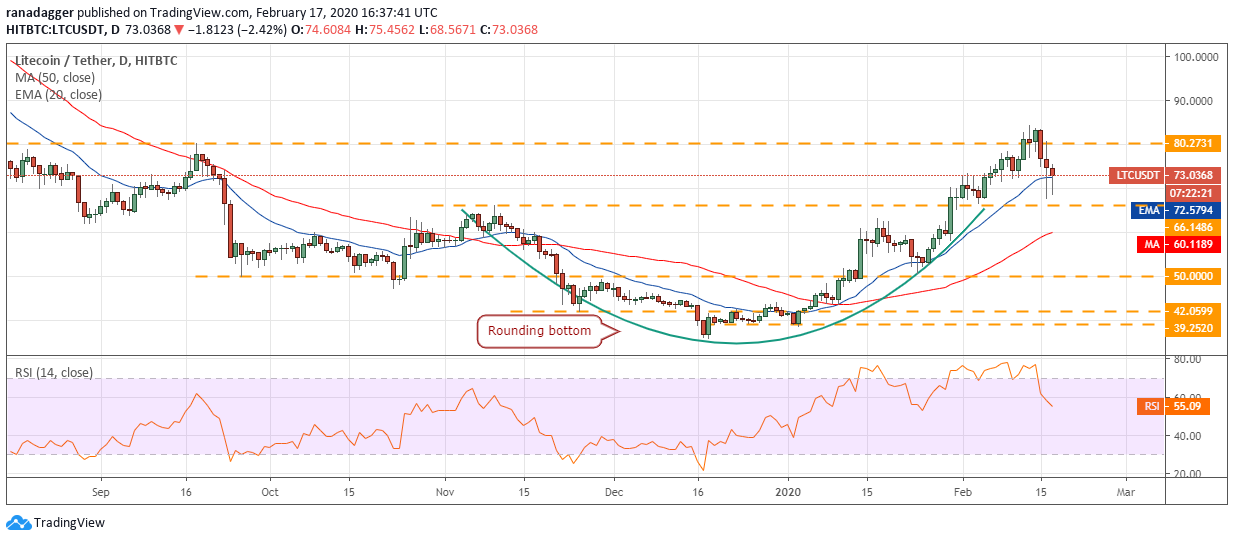
Though Litecoin (LTC) closed (UTC time) above $80.2731 on Feb. 14, the bulls could not build up on it. This attracted selling, which plunged the price below the 20-day EMA on Feb. 16. Though the price rebounded off the 20-day EMA, the bulls could not carry it above $80.2731.
LTC USD daily chart. Source: Tradingview
Currently, the bulls are attempting to defend the support at $66.1486. If successful, the LTC/USD pair might remain range-bound between $66.1486-$80.2731 for the next few days.
The pair will pick up momentum on a break above $85, whereas a drop below $66.1486 will turn the trend in favor of the bears. We might suggest long positions if the rebound off $66.1486 sustains.
EOS/USD
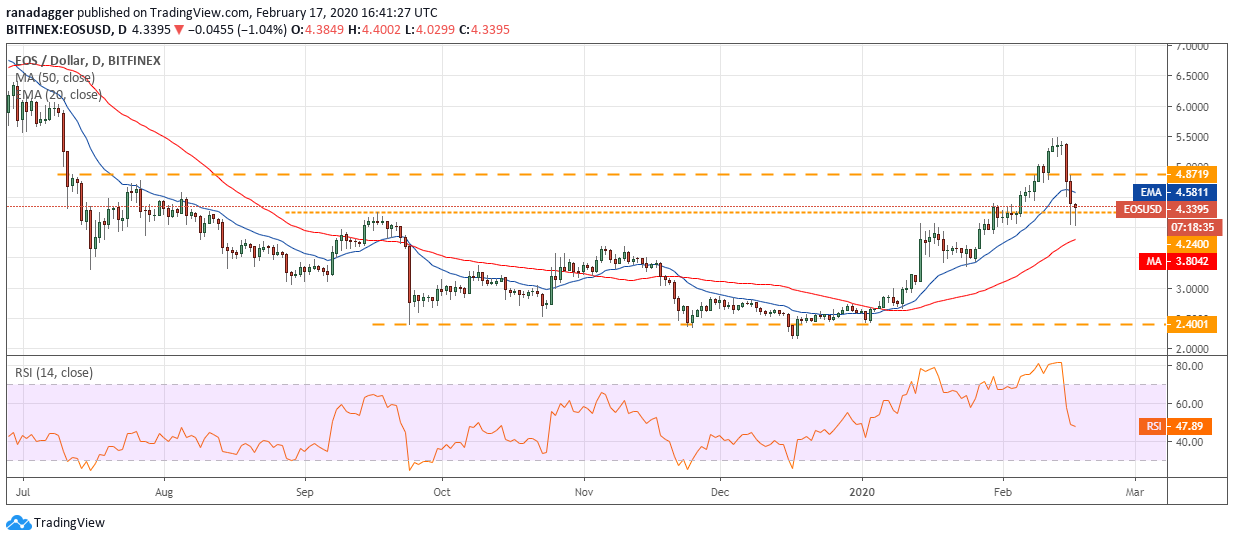
We had suggested the possibility of a pullback in EOS as the RSI was in the deeply overbought territory. However, we had expected the price to find support between $4.8719 and the 20-day EMA at $4.58.
EOS USD daily chart. Source: Tradingview
Contrary to our assumption, the pullback was sharp as it plunged below the support at $4.24. Currently, the bulls are attempting a rebound off $4.
If successful, the EOS/USD pair might consolidate between $4 and $4.8719 for a few days. The trend will turn negative on a break below the 50-day SMA at $3.80. We do not find any reliable buy setups at the current levels, hence, we suggest traders remain on the sidelines.
BNB/USD
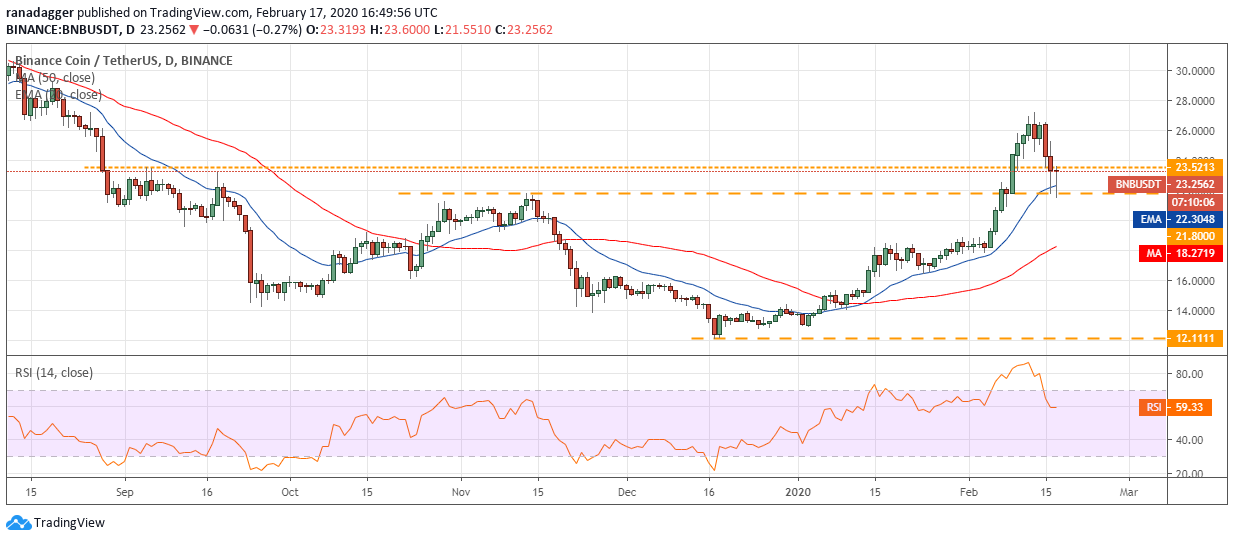
Binance Coin (BNB) plummeted below the support at $23.5213 and reached the next support at $21.80 on Feb. 16. Though the price rebounded sharply from $21.80, the bulls could not carry it above $23.5213, which shows selling at higher levels.
BNB USD daily chart. Source: Tradingview
Currently, the BNB/USD pair has again bounced off the support at $21.80. We anticipate the bulls to make another attempt to carry the price above $23.5213. If successful, a move to $27.1905 is likely.
Conversely, if the price turns down from $23.5213, the bears will make another attempt to sink the price below $18.26. For now, the traders can keep the stop loss on the long positions at $21.
XTZ/USD
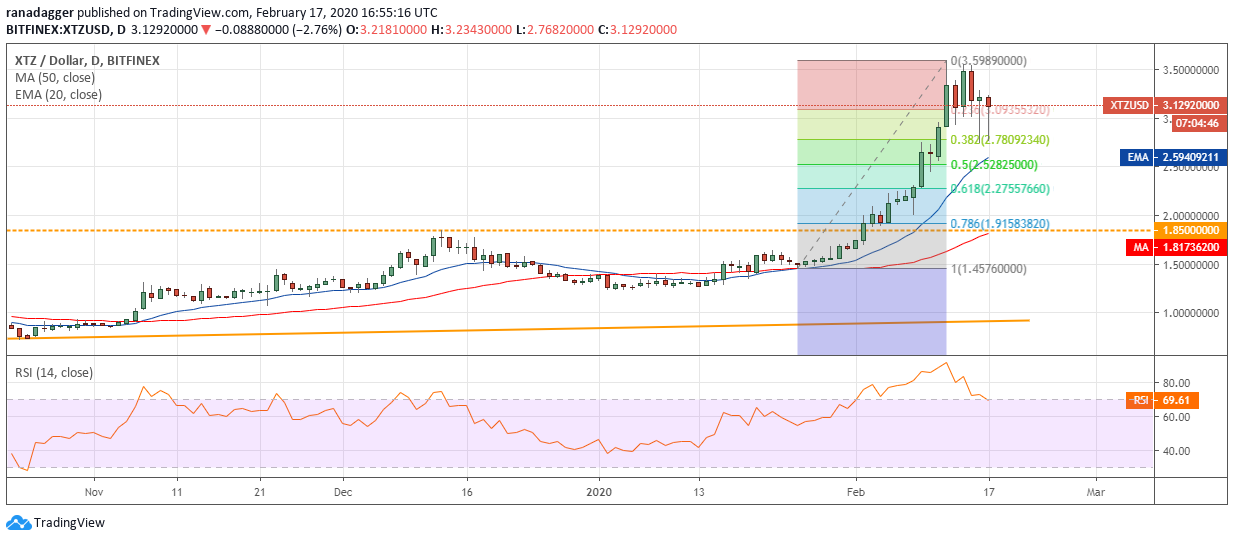
The bulls failed to push Tezos (XTZ) above the overhead resistance at $5.5989 on Feb. 14 and 15. That resulted in profit booking that dragged the price to just below $2.7809234 levels, which corresponds to 38.2% Fibonacci retracement level of this leg of the rally.
XTZ USD daily chart. Source: Tradingview
On Feb. 16, the price bounced sharply from $2.752 levels but the bulls could not sustain the higher levels. This shows that the sellers are back in action.
Currently, the bears are attempting to sink the price below $2.7809234. If successful, a drop to the 20-day EMA at $2.59 is possible. This is close to the 50% retracement level of the recent rally, hence, we expect the bulls to defend this level aggressively. We will wait for the XTZ/USD pair to stop falling before suggesting a trade in it.
ADA/USD
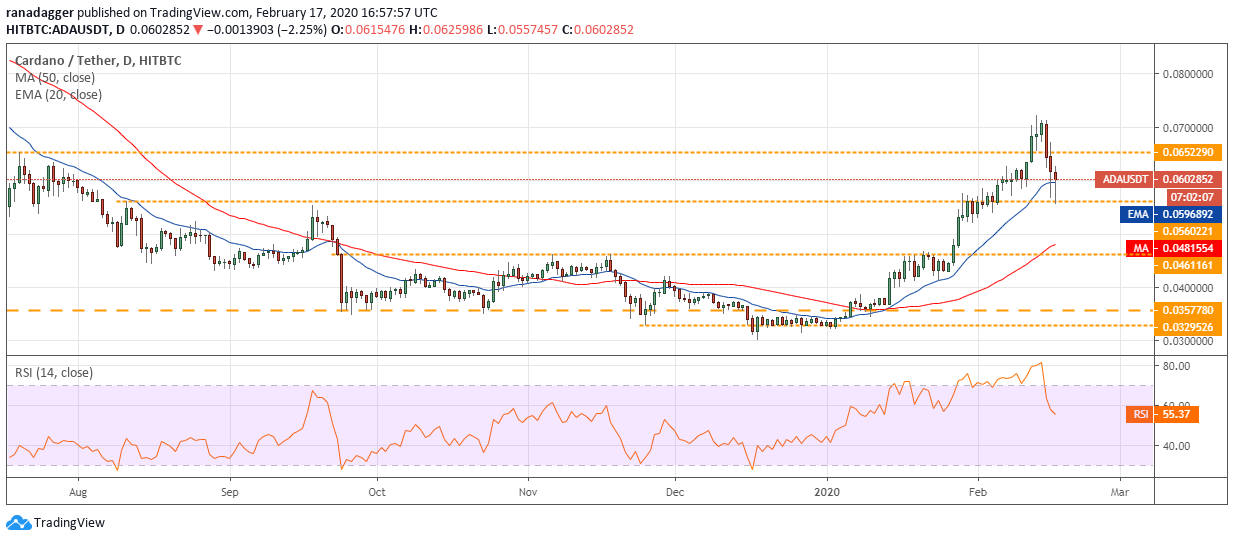
Cardano (ADA) turned down sharply on Feb. 15 and plunged below the previous resistance turned support of $0.65229. Selling continued on the next day and it dragged the price to the next support at $0.0560221.
ADA USD daily chart. Source: Tradingview
This fall triggered our suggested stop loss on the remaining long positions at $0.06. Currently the bears are attempting to sink the price below $0.0560221. If successful, the drop can extend to the 50-day SMA at $0.048.
Conversely, if the ADA/USD pair holds above $0.560221, the bulls will again attempt to carry the price above $0.065229. We will wait for the price to stop falling and suggest a turnaround before proposing a trade in it.
The views and opinions expressed here are solely those of the author and do not necessarily reflect the views of Cointelegraph. Every investment and trading move involves risk. You should conduct your own research when making a decision.
Market data is provided by HitBTC exchange.


