

Ripple is currently consolidating above the $0.2000 support against the US Dollar. XRP price is likely to start a strong increase above $0.2100 as long as it is above the 100 SMA (H4).
- Ripple price is currently trading nicely above the main $0.2000 support zone against the US dollar.
- The price is facing a few key resistances near the $0.2040 and $0.2075 levels.
- There is a major declining channel forming with resistance near $0.2040 on the 4-hours chart of the XRP/USD pair (data source from Kraken).
- The pair is likely to accelerate higher if there is a clear break above $0.2075.
Ripple Price Holding Crucial Uptrend Support
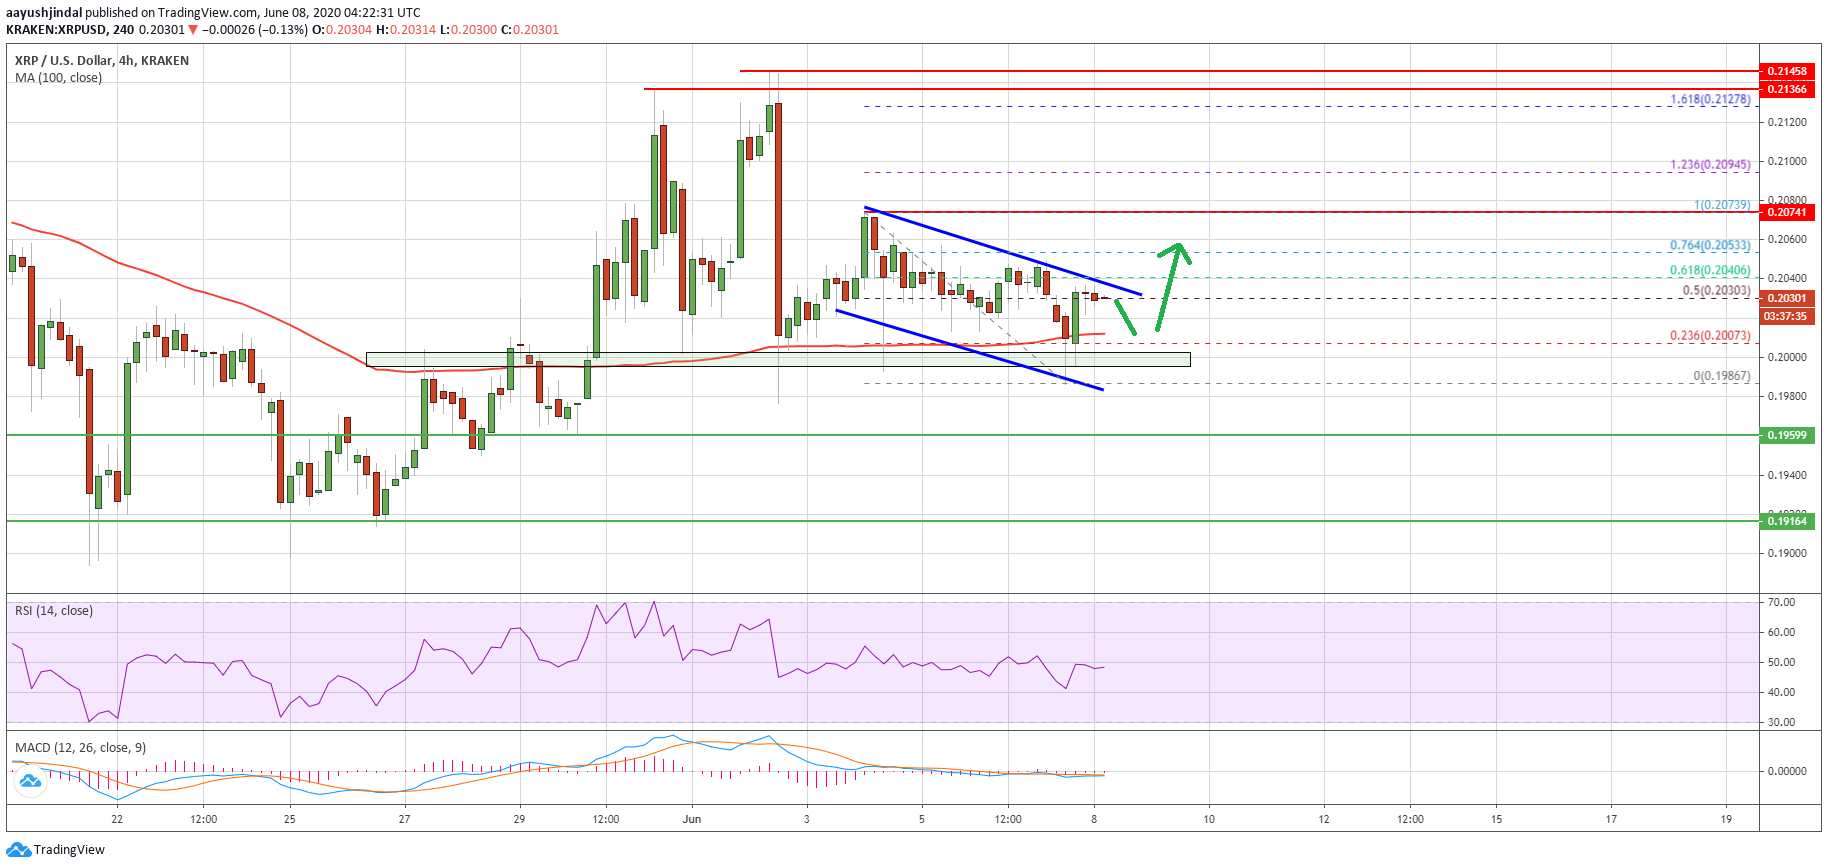
In the past few days, ripple followed a bearish path below the $0.2100 pivot level. XRP price broke the $0.2020 support zone, but it remained well bid above the $0.2000 support level.
The price is currently consolidating above the $0.2000 support and the 100 simple moving average (4-hours). The last swing high was near $0.2073 before the price declined towards $0.2000.
A low is formed near $0.1986 and the price is currently rising. XRP is trading above the 50% Fib retracement level of the recent decline from the $0.2073 high to $0.1986 low. It seems like there is a major declining channel forming with resistance near $0.2040 on the 4-hours chart of the XRP/USD pair.
The channel resistance is close to the 61.8% Fib retracement level of the recent decline from the $0.2073 high to $0.1986 low. If there is an upside break above the channel resistance, the price could test the key $0.2075 resistance zone.
A successful close above the $0.2075 resistance zone could open the doors for a larger upward move. The next major resistance is near the $0.2140 level, above which the bulls are likely to aim more gains towards $0.2250.
More Losses in XRP?
On the downside, there is a crucial support forming near $0.2000 and the 100 simple moving average (4-hours). If ripple fails to stay above the $0.2000 support, there is a risk of a larger decline.
A successful close below the $0.2000 support may perhaps lead the price towards the $0.1920 and $0.1900 support levels in the near term.
Technical Indicators
4-Hours MACD – The MACD for XRP/USD is slowly gaining momentum in the bullish zone.
4-Hours RSI (Relative Strength Index) – The RSI for XRP/USD is currently just below the 50 level.
Major Support Levels – $0.2000, $0.1920 and $0.1900.
Major Resistance Levels – $0.2040, $0.2075 and $0.2140.
Take advantage of the trading opportunities with Plus500
Risk disclaimer: 76.4% of retail CFD accounts lose money.

