Chainlink was among the first cryptocurrency to set a new all-time high in 2020, but given its absence during the 2017 peak was facing different circumstances and no overhead resistance. The altcoin was nearly unaffected entirely by the bear market over the last couple of years, breaking record after record.
However, a massive bearish divergence has formed as the unstoppable cryptocurrency touches an ascending trendline for the third time. Could this be the start of the altcoin’s first extended bear phase? Or are bulls preparing a much stronger push to finally blast through the long-term trendline?
Chainlink At Risk Of First Major Corrective Phase, According To Bear Div
In 2017, Bitcoin’s meteoric rise and the explosion of ICOs built on Ethereum put the cryptocurrency asset class on the map. But after a storm of exuberance and parabolic price action, the bubble burst and these assets came crashing down by as much as 90% or more in many cases.
Even the crypto asset with the most longevity, Bitcoin, fell a full 84% from high to low, resulting in a three year bear market. During that time, however, Chainlink made its debut in the crypto space, and its been on an unstoppable uptrend ever since.
Related Reading | Analyst: After A 50% Retrace Against Bitcoin, Chainlink Is “Ready” To Soar
The altcoin rose from nearly worthless to over $25 recently at its 2021 peak. Chainlink went from being born during a bear market, to hitting all-time highs left and right even before a bull market was confirmed.
Since things turned bullish, even Chainlink joined in Bitcoin and Ethereum and set yet another record peak. The entire market has once again turned back down, but the soaring altcoin remains near 2021 highs.
$LINK, 🧐 pic.twitter.com/bKsLeUgnsi
— 🌏The EW Guy (@TheEWGuy) January 25, 2021
Bearish Divergence, Or Are Bulls Baiting For The Next Move Up?
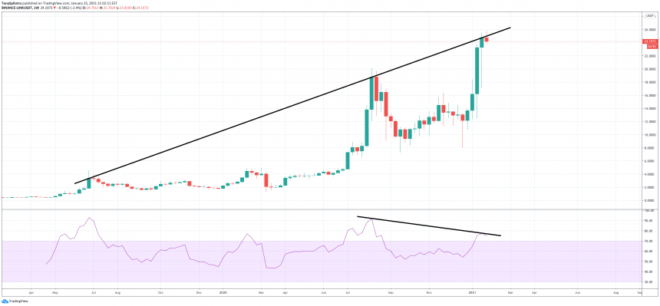
The recent push to $25 per token, has resulted in a massive bearish divergence on the weekly Relative Strength Index, spanning across the current peak and the 2020 high of $20, according to one crypto trader.
Coinciding with the bearish technical signal, is a more three-year long trendline that has acted as the top to every major rally. The chart below shows the long-term trendline on the LINKUSDT trading pair on Binance more clearly.
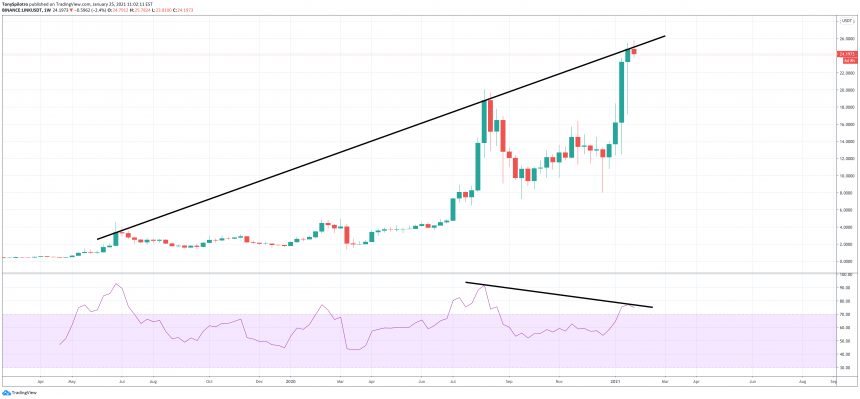
A massive bearish divergence spans across two years of LINKUSDT price action | Source: LINKUSDT on TradingView.com
Bearish divergences appear when price action sets a higher high, but a technical indicator on the same timeframe chart makes a lower low. It often suggests that although prices are reaching new highs, the underlying buying pressure is lower than during the first peak.
The weakness results in bears taking over, and forcing prices lower. Bearish divergences often appear at the top of a trend, but are difficult to act on.
Related Reading | Altcoin Expert: Buy Crypto That Holds Up During Bitcoin Breakdown
Bearish divergences are only confirmed once price action has turned down. The lack of a higher high on a technical indicator could merely be due to the fact the bullish move is only yet just beginning. Taking a position in a long up-trending altcoin due to a bearish divergence could lead to any missing out on any additional legs up that might follow.
Given Chainlink’s long-term momentum, the bearish divergence – if invalidated – could supply the momentum needed for a much stronger push higher.
Featured image from Deposit Photos, Charts from TradingView.com