Bitcoin to See Paramount Technical Event
Bitcoin (BTC) has always been cyclical. Throughout its ten years as a tradable asset, investors have found that the asset follows mostly clear-cut patterns and cycles, marked by time and certain technical indicators.
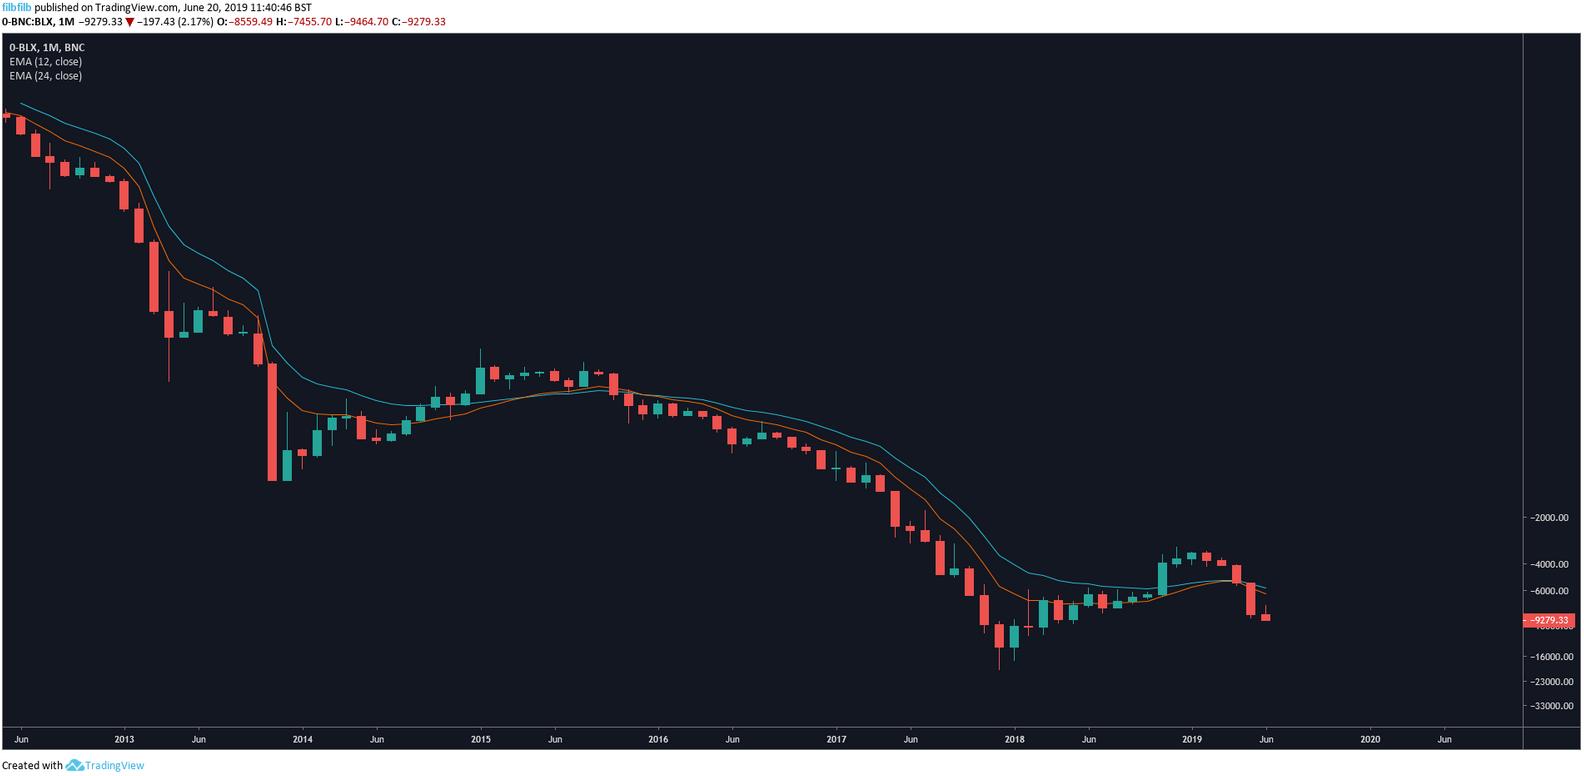
As spotted by Filb Filb, a prominent cryptocurrency analyst who believes BTC reaching $100,000 and beyond is possible, the Moving Average Convergence Divergence (MACD) on Bitcoin’s one-month chart is about to experience an extremely bullish crossover. More specifically, the indicator, meant to observe overarching trends, is about to see its third monthly bullish cross in Bitcoin’s history.
The last time that this was seen was when BTC embarked on its bull run from the low triple digits ($300) to $20,000. While short-term MACD readings often are susceptible to so-called “fake outs” (fake breakouts), the one-month MACD is a solid indicator for long-term price action. It is important to note that the MACD has yet to cross into the green, but should if Bitcoin manages to close June strong, maybe above $9,500 or so.
In a later tweet, Filb continued his bullish spiel, asking his followers if they would “long this.” His implication was that this chart, which is inverse of current BTC price action, looks extremely bearish (and thus bullish due to the inverse), as a result of (inverse) Bitcoin crossing under its 12-month and 24-hour exponential moving averages.

Not the Only Bullish Sign
It is important to note that this isn’t the only clearly bullish sign that Bitcoin has recently experienced. Per previous reports from this outlet, Bitcoin’s weekly chart is currently experiencing a massive “bullish engulfing candle”. Analyst Josh Rager claims that this pattern, which includes a strong pullback (black candle) and a subsequent bullish reversal (engulfing white candle), is what “led to continued uptrend last bull cycle.” The fact that BTC is seeing this now is, in Rager’s eyes, a sign that Bitcoin will see “new yearly highs” in the coming weeks and months.
That’s not all though. Rager recently noted that the Super Guppy, an indicator that singles out overarching trends, has flipped from red to grey on Bitcoin’s one-week chart after it flipped from grey to green on Bitcoin’s three-day chart. This occurred when BTC pushed past $7,000 just weeks ago. While the one-week Super Guppy isn’t green yet, signaling a clear uptrend, Rager notes that Guppys are “lagging indicator”, meaning that the change from red to interim grey makes for a “strong confirmation” of a bull trend.
And most importantly, Bitcoin recently closed its fourth consecutive weekly candle above its 50-week moving average, a series of events that have never failed to mark a bull run in the past.
Title Image Courtesy of Pixabay.com


