

- Bitcoin price extended gains above the key $10,600 and $10,800 resistances against the US Dollar.
- The price is currently correcting lower after trading to a new weekly high at $10.960.
- Yesterday’s highlighted major bullish trend line is intact with support near $10,500 on the hourly chart of the BTC/USD pair (data feed from Kraken).
- The price could correct lower, but it seems like the bulls are eyeing a test of the $11,200 resistance area.
Bitcoin price is gaining bullish momentum above $10,500 against the US Dollar. BTC is likely to climb towards $11,200 or $11,400 as long as it stays above $10,500.
Bitcoin Price Analysis
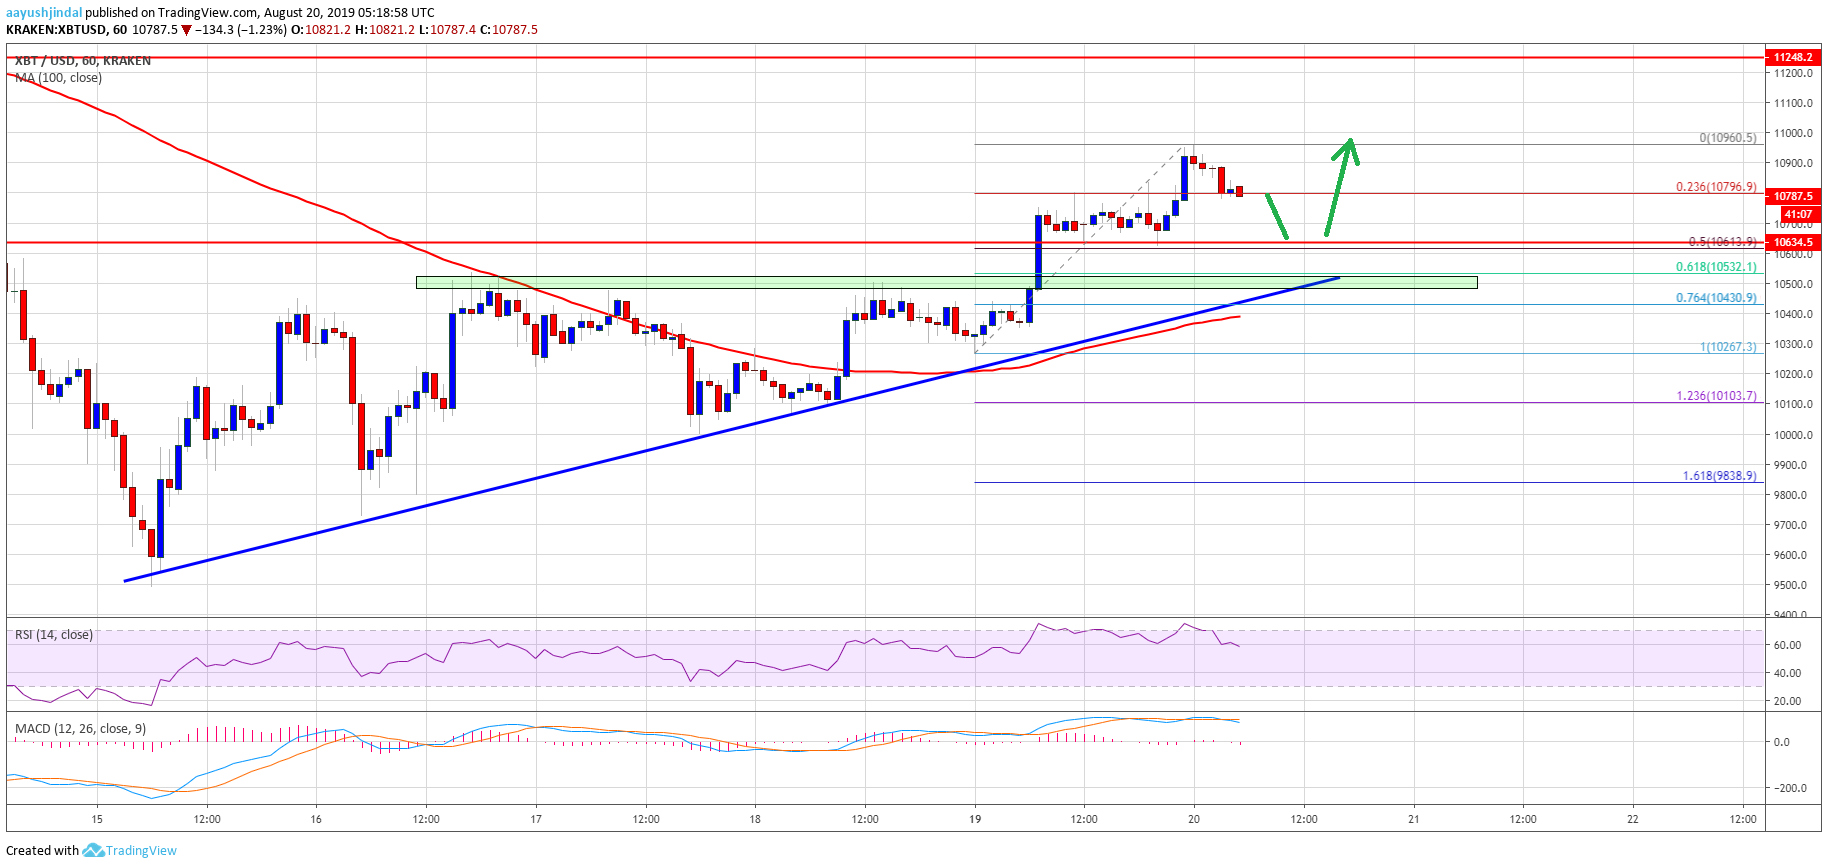
Yesterday, we discussed the chances of a strong rise in BTC if it breaks $10,600 against the US Dollar. The price did gain bullish momentum above the $10,500 and $10,600 resistance levels. It opened the doors for more gains above the $10,700 level and the 100 hourly simple moving average. Finally, the price surpassed the $10,800 resistance and traded to a new weekly high at $10,960.
Recently, the price started a downside correction below the $10,900 level. Moreover, it traded below the 23.6% Fib retracement level of the recent wave from the $10,267 low to $10,960 high. It seems like there could be an extended downside correction towards the $10,500 support level. An immediate support is near the $10,600 level (the previous resistance). Additionally, the 50% Fib retracement level of the recent wave from the $10,267 low to $10,960 high is near the $10,600 level.
More importantly, yesterday’s highlighted major bullish trend line is intact with support near $10,500 on the hourly chart of the BTC/USD pair. Bitcoin price clearly remains well supported on the downside near the $10,600 and $10,500 support levels. If there is a bearish break and close below $10,500 plus the 100 hourly simple moving average, the price could move back into a bearish zone.
On the upside, an immediate resistance is near the recent high at $10,960, followed by $11,000. If the price continues to rise, the next important resistance is near the $11,200 and $11,250 levels.
Looking at the chart, bitcoin price is trading nicely above the $10,500 support level. As long as there is no daily close below $10,500, there are high chances of more upsides towards $11,200 in the coming sessions. Additionally, if the bulls remain in action, they might be able to push the price towards the $11,400 level.
Technical indicators:
Hourly MACD – The MACD is slowly moving back into the bearish zone.
Hourly RSI (Relative Strength Index) – The RSI for BTC/USD is currently correcting lower towards the 50 level.
Major Support Levels – $10,600 followed by $10,500.
Major Resistance Levels – $10,960, $11,000 and $11,200.

