

- Bitcoin price failed to climb above $8,800 and declined sharply below $8,400 against the US Dollar.
- The price failed to hold the key $8,250 support and it even spiked below the $8,000 support.
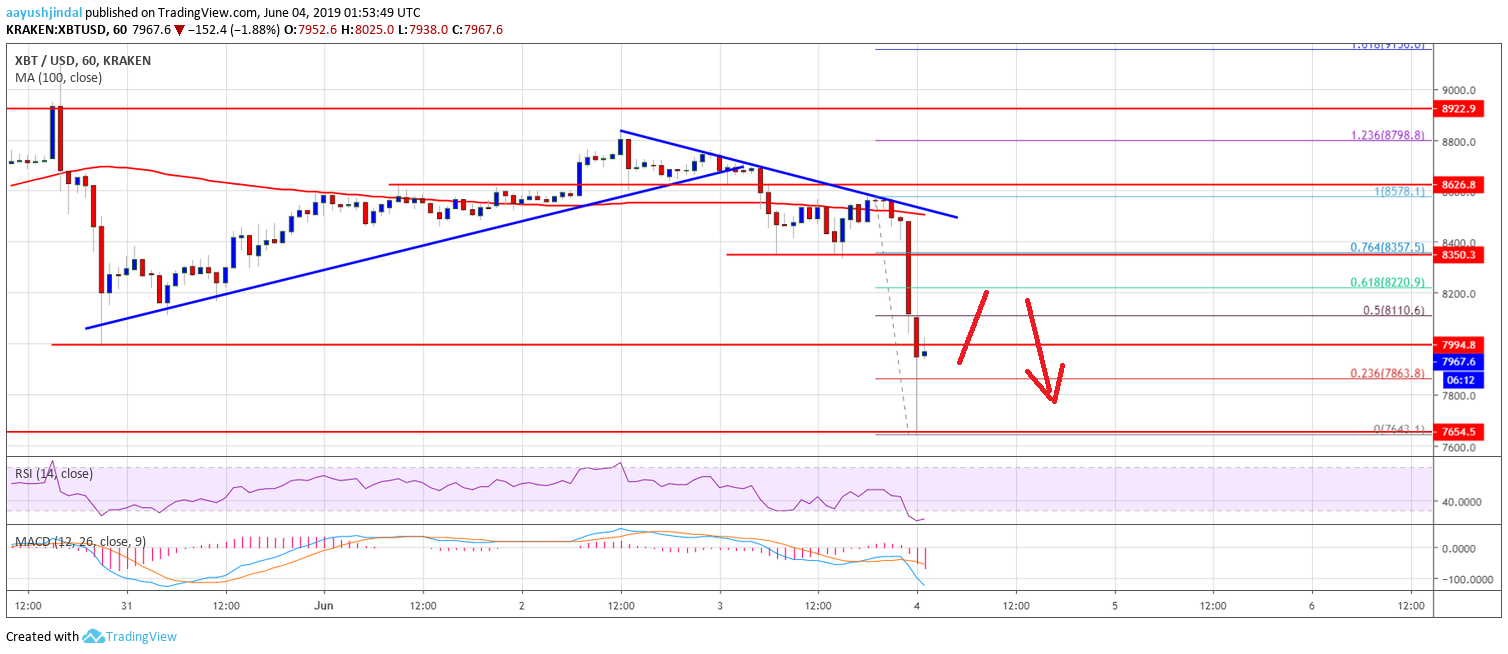
- There is a major bearish trend line forming with resistance near $8,440 on the hourly chart of the BTC/USD pair (data feed from Kraken).
- The pair is currently correcting higher, but it is likely to face sellers near $8,200 and $8,350.
Bitcoin price is currently trading in a bearish zone below $8,400 against the US Dollar. BTC could start a sharp upward move above the $8,800 and $8,850 resistance levels.
Bitcoin Price Analysis
After a steady rise, bitcoin price faced sellers near the $8,800 level against the US Dollar. The BTC/USD pair failed to clear the $8,800 resistance and recently started a downward move. There was a sharp decline from the $8,578 swing high below the $8,400 support area. The price even settled below $8,220 and the 100 hourly simple moving average. The decline was such that the price even spiked below the $8,000 support area. A new weekly low was formed near $7,643 and the price is currently correcting higher.
It is currently trading near $8,000 and above the 23.6% Fib retracement level of the recent decline from the $8,578 high to $7,643 low. On the upside, an initial resistance is near the $8,100 area. The 50% Fib retracement level of the recent decline from the $8,578 high to $7,643 low is also near the $8,110 level. If there is an upside break above the $8,110 level, the price may even recover above $8,200. The main hurdles on the upside are near $8,350 and $8,400. Moreover, there is a major bearish trend line forming with resistance near $8,440 on the hourly chart of the BTC/USD pair.
The trend line coincides with the 76.4% Fib retracement level of the recent decline from the $8,578 high to $7,643 low. Moreover, the 100 hourly SMA is also near the $8,400 resistance area. Therefore, if the price corrects higher, it is likely to face a strong resistance near the $8,400 area.
Looking at the chart, bitcoin price clearly moved into a bearish zone below $8,400 and $8,200. In the short term, there could be more losses and sellers are likely to remain active. Only a close below $8,400 might reverse the recent decline. On the downside, the main supports are near $7,650 and $7,440.
Technical indicators:
Hourly MACD – The MACD is currently gaining momentum in the bearish zone.
Hourly RSI (Relative Strength Index) – The RSI for BTC/USD declined sharply below the 40 level, with a bearish angle.
Major Support Levels – $7,650 followed by $7,440.
Major Resistance Levels – $8,200, $8,400 and $8,500.


