

- Bitcoin price is trading in a downtrend below $8,800 and $9,000 against the US Dollar.
- The price is currently declining and it seems to be struggling near the $8,840 level.
- Yesterday’s major bearish trend line is active with resistance near $8,920 on the hourly chart of the BTC/USD pair (data feed from Kraken).
- The bulls need to push the price above $8,840 and $8,920 to start a decent recovery.
Bitcoin price is struggling to gain ground above $8,800 against the US Dollar. Recently, BTC traded as low as $8,560 and it remains at a risk of more losses below $8,500.
Bitcoin Price Analysis
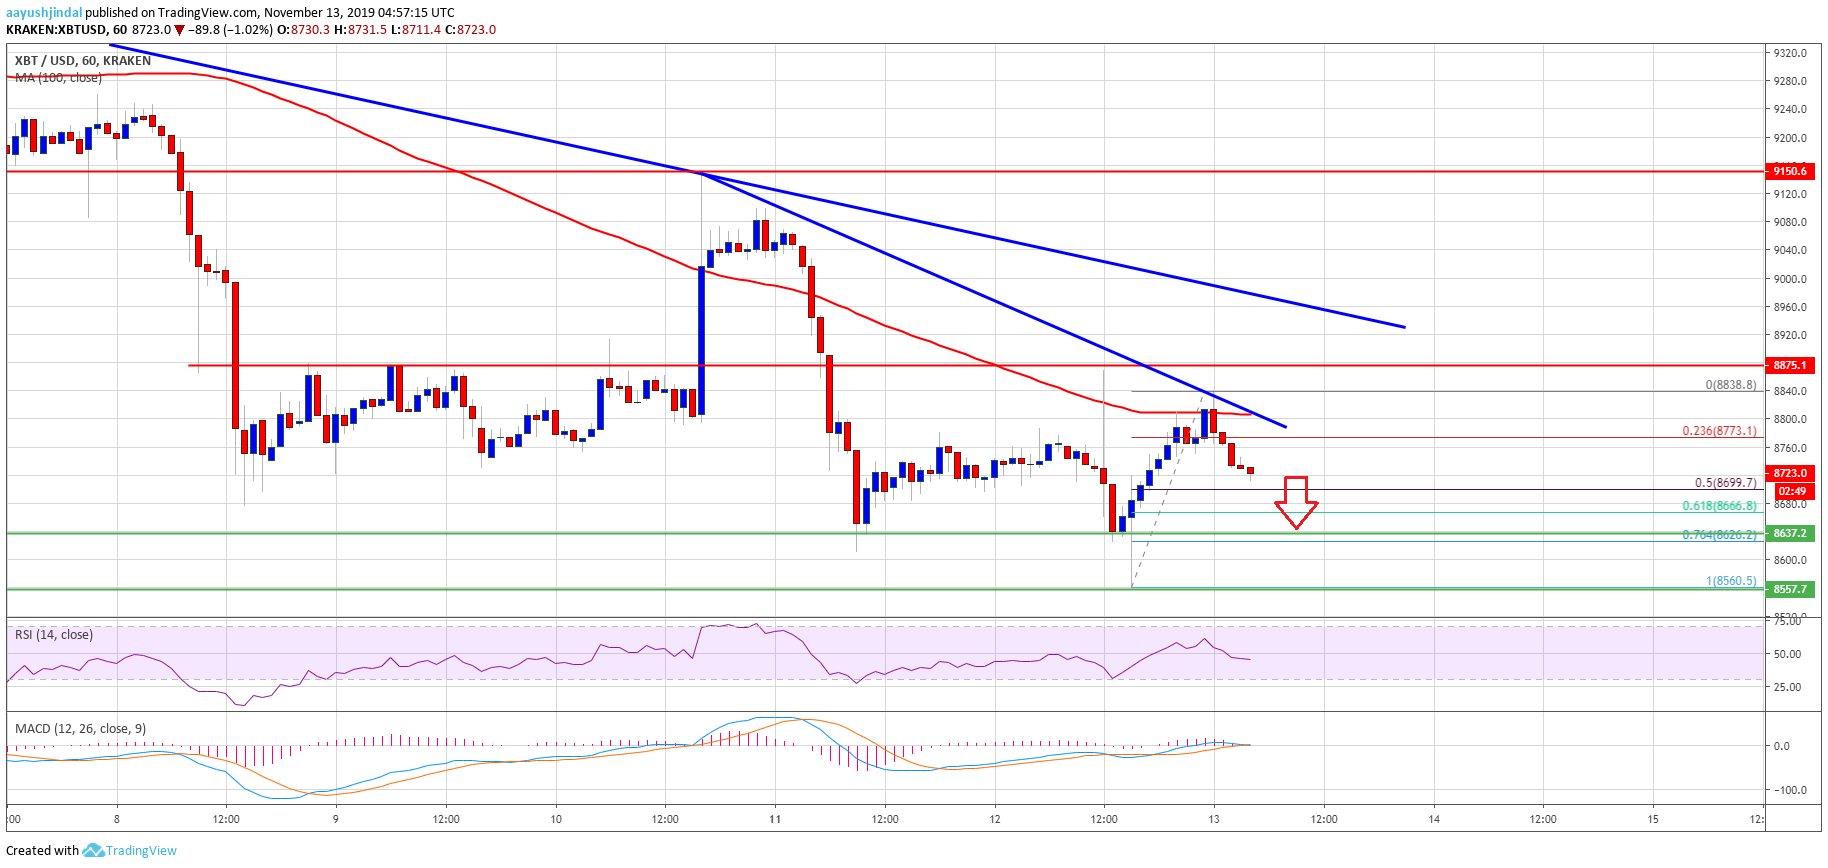
In the past few days, there were lower lows formed in bitcoin after it settled below $9,000 against the US Dollar. BTC seems to be following a downtrend below the $8,880 resistance area and the 100 hourly simple moving average.
The recent decline was such that the price traded below the $8,640 level. Moreover, there was a break below the $8,600 support and the price traded close to $8,550. A new monthly low was formed near $8,560 before the price recovered above $8,700.
However, the price seems to be facing a strong resistance near the $8,800 level and the 100 hourly simple moving average. At the moment, the price is declining and is trading below $8,780.
Besides, there was a break below the 23.6% Fib retracement level of the recent wave from the $8,560 low to $8,838 high. An immediate support is near the $8,700 level.
The 50% Fib retracement level of the recent wave from the $8,560 low to $8,838 high is also near the $8,700 level. If there is a downside break below $8,700, there is a risk of more downsides. The next support is near the $8,560 low.
Any further losses could push bitcoin below the key $8,500 support area. In the mentioned bearish scenario, the price is likely to test the $8,300 support area in the near term.
On the upside, there are many resistances, starting with $8,800 and the 100 hourly SMA. More importantly, yesterday’s major bearish trend line is active with resistance near $8,920 on the hourly chart of the BTC/USD pair.
Looking at the chart, bitcoin is facing an increase in selling pressure below $8,800. If it fails to stay above $8,700, the bears could gain momentum for a push below the $8,600 and $8,500 levels.
Technical indicators:
Hourly MACD – The MACD is currently moving back into the bearish zone.
Hourly RSI (Relative Strength Index) – The RSI for BTC/USD is currently below the 50 level, with a few positive signs.
Major Support Levels – $8,560 followed by $8,500.
Major Resistance Levels – $8,800, $8,850 and $8,920.


