

- Bitcoin price started a downside correction after tagging the $8,300 resistance against the US Dollar.
- The price tested the $7,575-7,600 support area and recently rebounded towards $8,100.
- Yesterday’s highlighted important bullish trend line is intact with support near $7,810 on the hourly chart of the BTC/USD pair (data feed from Kraken).
- The pair is likely to trade in a range before the next move either towards $8,300 or below $7,575.
Bitcoin price is holding a couple of important supports near $7,600 against the US Dollar. BTC could either climb above $8,100 and $8,300 or start another decline below the $7,575 low.
Bitcoin Price Analysis
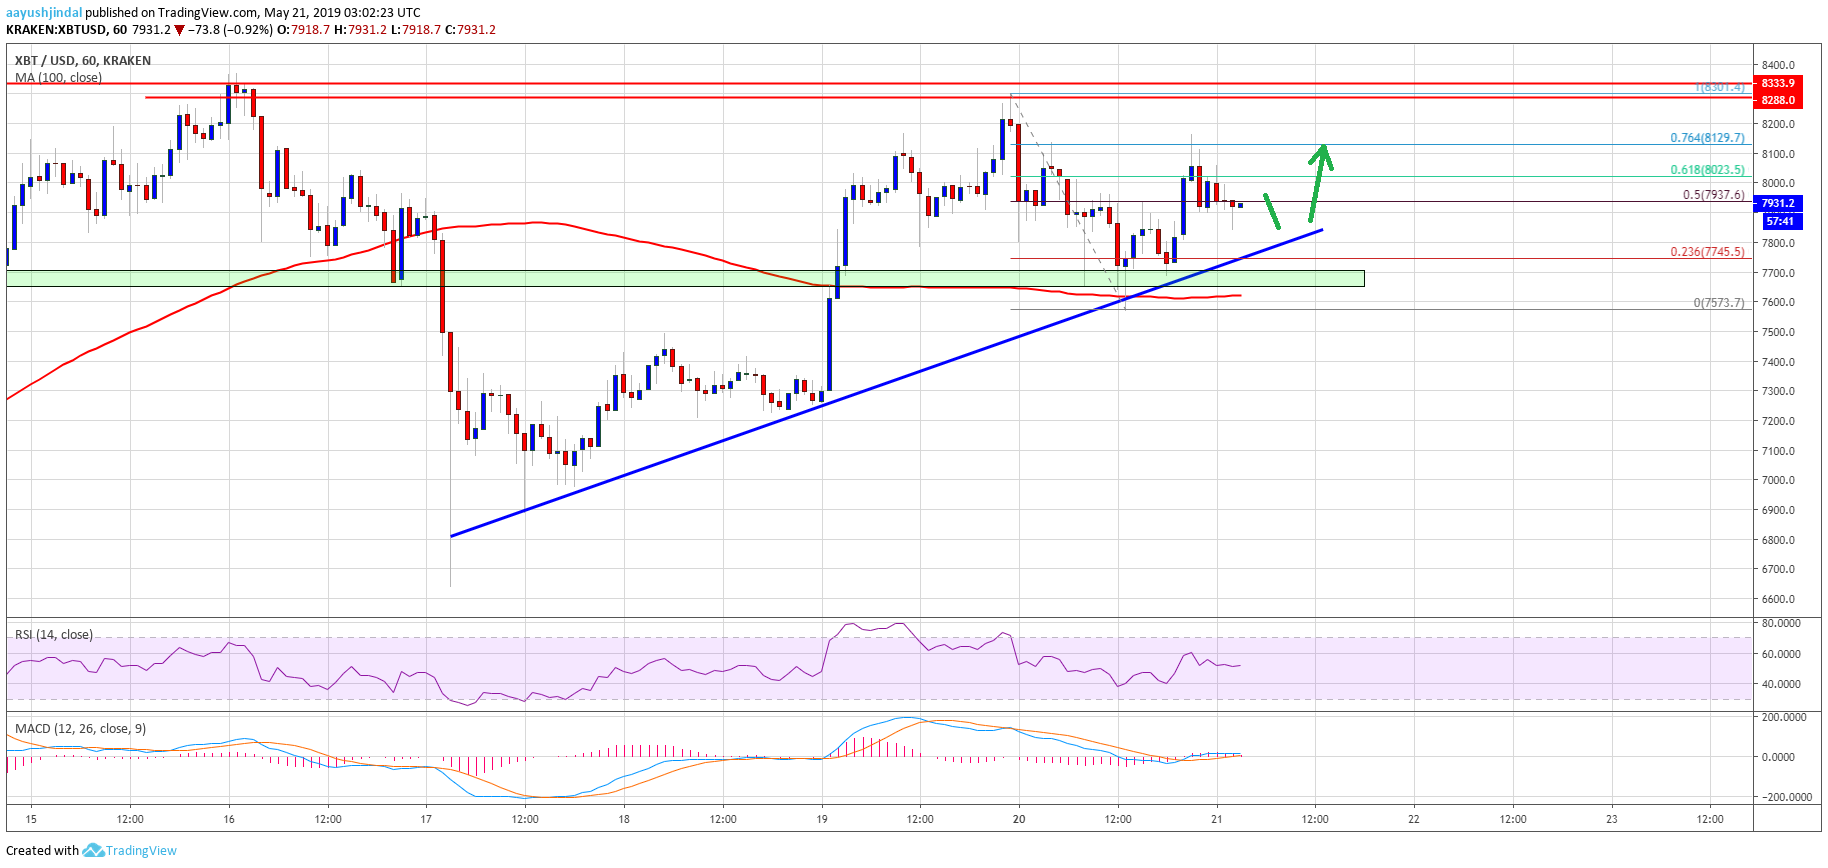
After a strong rebound, bitcoin price tested the key $8,300 resistance area against the US Dollar. The BTC/USD pair traded as high as $8,301 and later corrected lower. It traded below the $8,000 and $7,800 support levels. However, the pair found a strong buying interest near the $7,600 support level and a swing low was formed at $7,575. Recently, the price recovered above the $7,800 level and stayed well above the 100 hourly simple moving average.
Moreover, there was a break above the 50% Fib retracement level of the last decline from the $8,301 high to $7,575 low. The price traded above the $8,000 level, but it failed to gain momentum above the $8,120 level. Besides, the 76.4% Fib retracement level of the last decline from the $8,301 high to $7,575 low acted as a strong resistance. The price is currently trading below $8,000, with many supports near the $7,800 and $7,850 levels. More importantly, yesterday’s highlighted important bullish trend line is intact with support near $7,810 on the hourly chart of the BTC/USD pair.
The main support on the downside is near the $7,600 area and the 100 hourly simple moving average. If there is a successful close below the 100 hourly SMA, there could be additional losses towards the $7,300 or $7,200 support. On the upside, a convincing break above the $8,120 level may open the doors for more gains. The main hurdle for the bulls is near the $8,300 level, above which there could be a solid rally towards $8,500.
Looking at the chart, bitcoin price is clearly trading above the key $7,800 and $7,600 support levels. As long as there is no close below $7,600, there are high chances of an upside break above the $8,120 and $8,300 resistance levels in the coming sessions.
Technical indicators:
Hourly MACD – The MACD is slightly placed in the bullish zone.
Hourly RSI (Relative Strength Index) – The RSI for BTC/USD is currently above the 50 level, with a flat structure.
Major Support Levels – $7,810 followed by $7,600.
Major Resistance Levels – $8,120, $8,250 and $8,300.


