

- Bitcoin price is facing a strong resistance near the $7,400 and $7,460 levels against the US Dollar.
- The price is approaching the key $7,200 and $7,160 support levels.
- There is a short term declining channel forming with resistance near $7,380 on the hourly chart of the BTC/USD pair (data feed from Kraken).
- The pair could recover above $7,400 as long as there is no daily close below $7,200.
Bitcoin price is currently confined in a range below $7,400 against the US Dollar. BTC must stay above $7,200 and $7,000 to start a decent recovery.
Bitcoin Price Analysis
Recently, we saw a downside break in bitcoin below the $7,400 support against the US Dollar. Moreover, BTC price settled below the $7,400 pivot and the 100 hourly simple moving average.
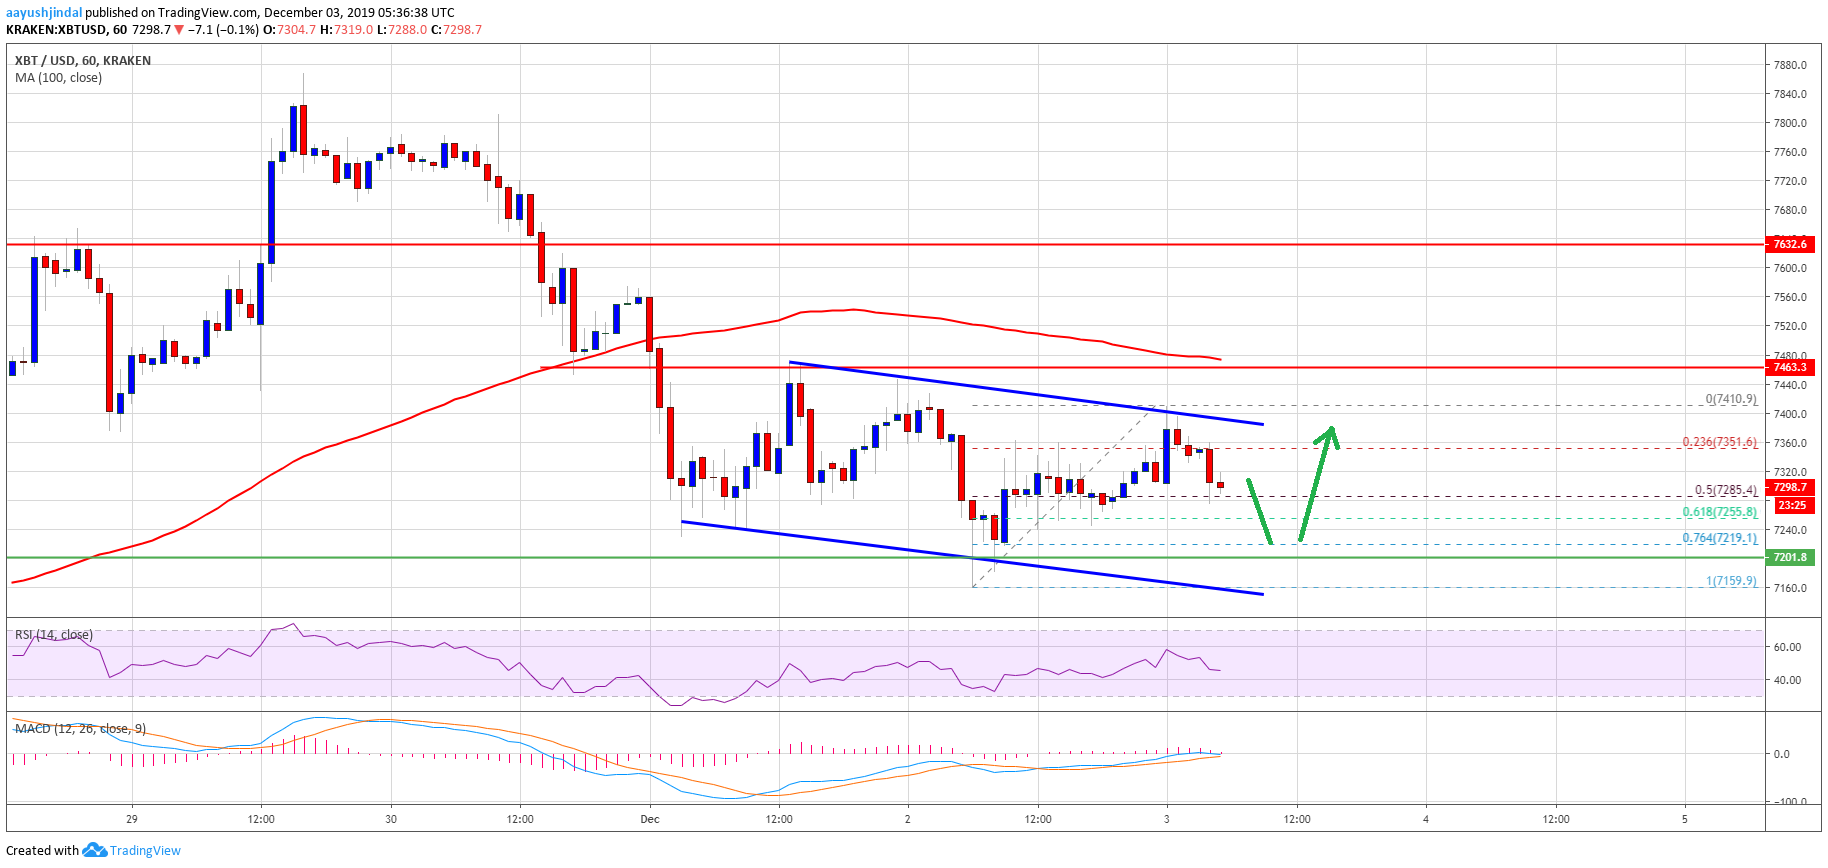
Finally, the price traded to a new weekly low at $7,159 and it is currently correcting higher. The recent high was near $7,410 and it seems like the price is struggling to gain strength above the $7,410 resistance.
Bitcoin is currently declining and trading below $7,400. Besides, there was a break below the 23.6% Fib retracement level of the recent corrective wave from the $7,159 low to $7,410 high.
An immediate support on the downside is near the $7,285 level. Additionally, the 50% Fib retracement level of the recent corrective wave from the $7,159 low to $7,410 high is near the $7,285 level.
If there is a downside push below the $7,285 and $7,255 levels, the price is likely to retest the $7,200 support area. More importantly, if there is a daily close below the $7,200 support area, the price may perhaps struggle to even stay above the $7,000 support.
On the upside, there are many hurdles waiting near the $7,400 and $7,460 levels. Besides, there is a short term declining channel forming with resistance near $7,380 on the hourly chart of the BTC/USD pair.
Therefore, a clear break above the channel resistance and $7,460 is needed for a decent recovery wave. Once the price settles above $7,460 and the 100 hourly simple moving average, the bulls are likely to aim the $7,630 resistance area.
Looking at the chart, bitcoin price is currently declining and trading below the $7,300 level. It seems like the price could retest the $7,200 support area before it could make an attempt to climb above $7,400 and $7,460 in the near term.
Technical indicators:
Hourly MACD – The MACD is likely to move into the bearish zone.
Hourly RSI (Relative Strength Index) – The RSI for BTC/USD is currently declining and it now well below the 50 level.
Major Support Levels – $7,200 followed by $7,000.
Major Resistance Levels – $7,400, $7,460 and $7,630.
