

- Bitcoin is trading more than 150 percent higher from its March 2020 lows below $4,000.
- The cryptocurrency’s wild move upside has cheered traders, but a textbook technical indicator warns about a potential bull trap.
- There are possibilities of Bitcoin falling towards $6,700 if the fractal plays out as indicated.
A textbook technical indicator may spoil the ongoing bitcoin price rally.
Dubbed as Rising Wedge, the bearish pattern forms when an asset’s uptrend leaves behind a trail of successive higher highs and higher lows. The result that appears is two converging, rising trendlines meeting at an apex. Meanwhile, a falling trade volume data complements the Rising Wedge.
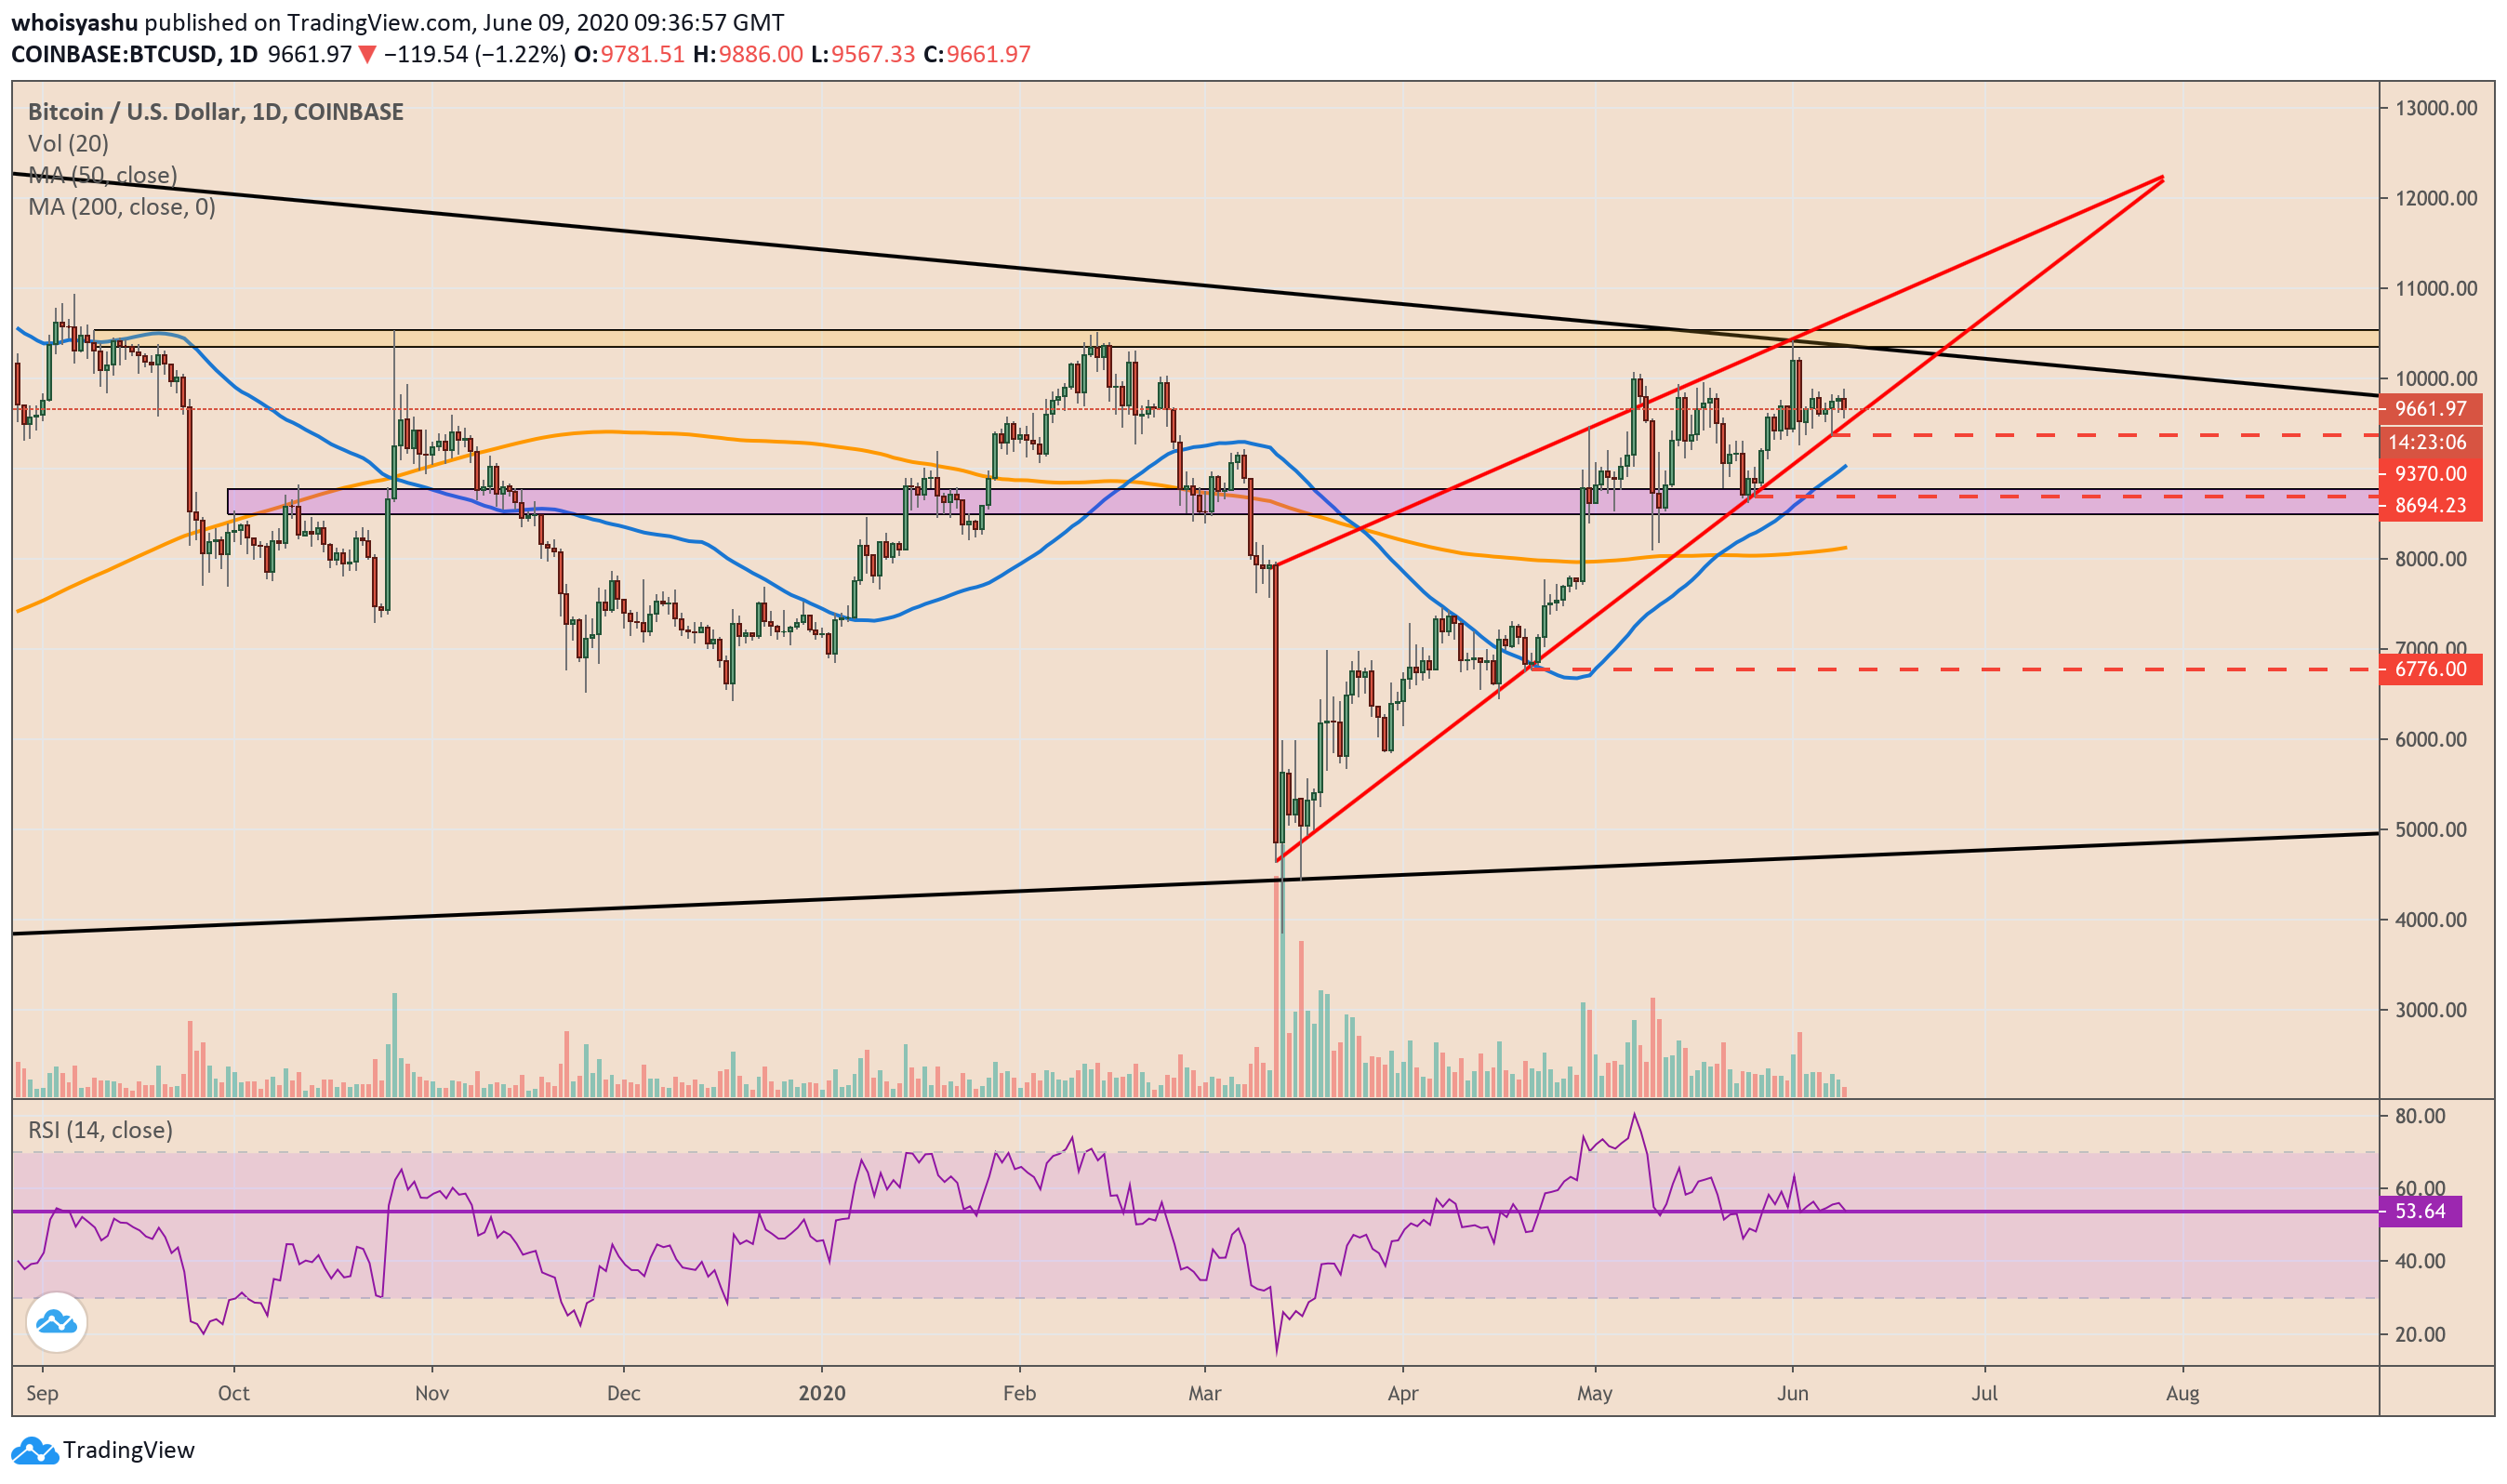
Bitcoin Wedge
Bitcoin is currently trending upwards in a similar pattern. The cryptocurrency’s 150 percent recovery rally formed consecutive reactions highs and lows on two converging trendlines. At the same time, its daily volume dipped against the rising price, confirming a Rising Wedge pattern.
The price is halfway into the pattern, currently testing its support trendline for a potential bounce-back towards the resistance trendline. The reversal may push bitcoin above $10,000, albeit under risks of a pullback towards the Wedge support all over again.
The pattern may repeat until the upper, and lower trendlines converge. That would make the advances from support shorter, thereby making the entire rally unconvincing. A bearish confirmation of the Rising Wedge pattern would appear once price breaks below the lower trendline.
The Breakdown Targets
The Rising Wedge pattern can stretch Bitcoin’s ongoing rally until its apex, which sits near $12,000. There also can be negative breakouts, or breakdowns, below the lower trendline before the price hits the convergence top.
In the current scenario, a breakdown would lead the bitcoin price down towards $8,694 while eyeing $6,776 as its primary downside target. If the price happens to break bearish at a later stage, then it should push the downside targets to $9,661, followed by $8,694.
The charts will confirm a bearish breakout if the trade volume spikes near the Wedge support.
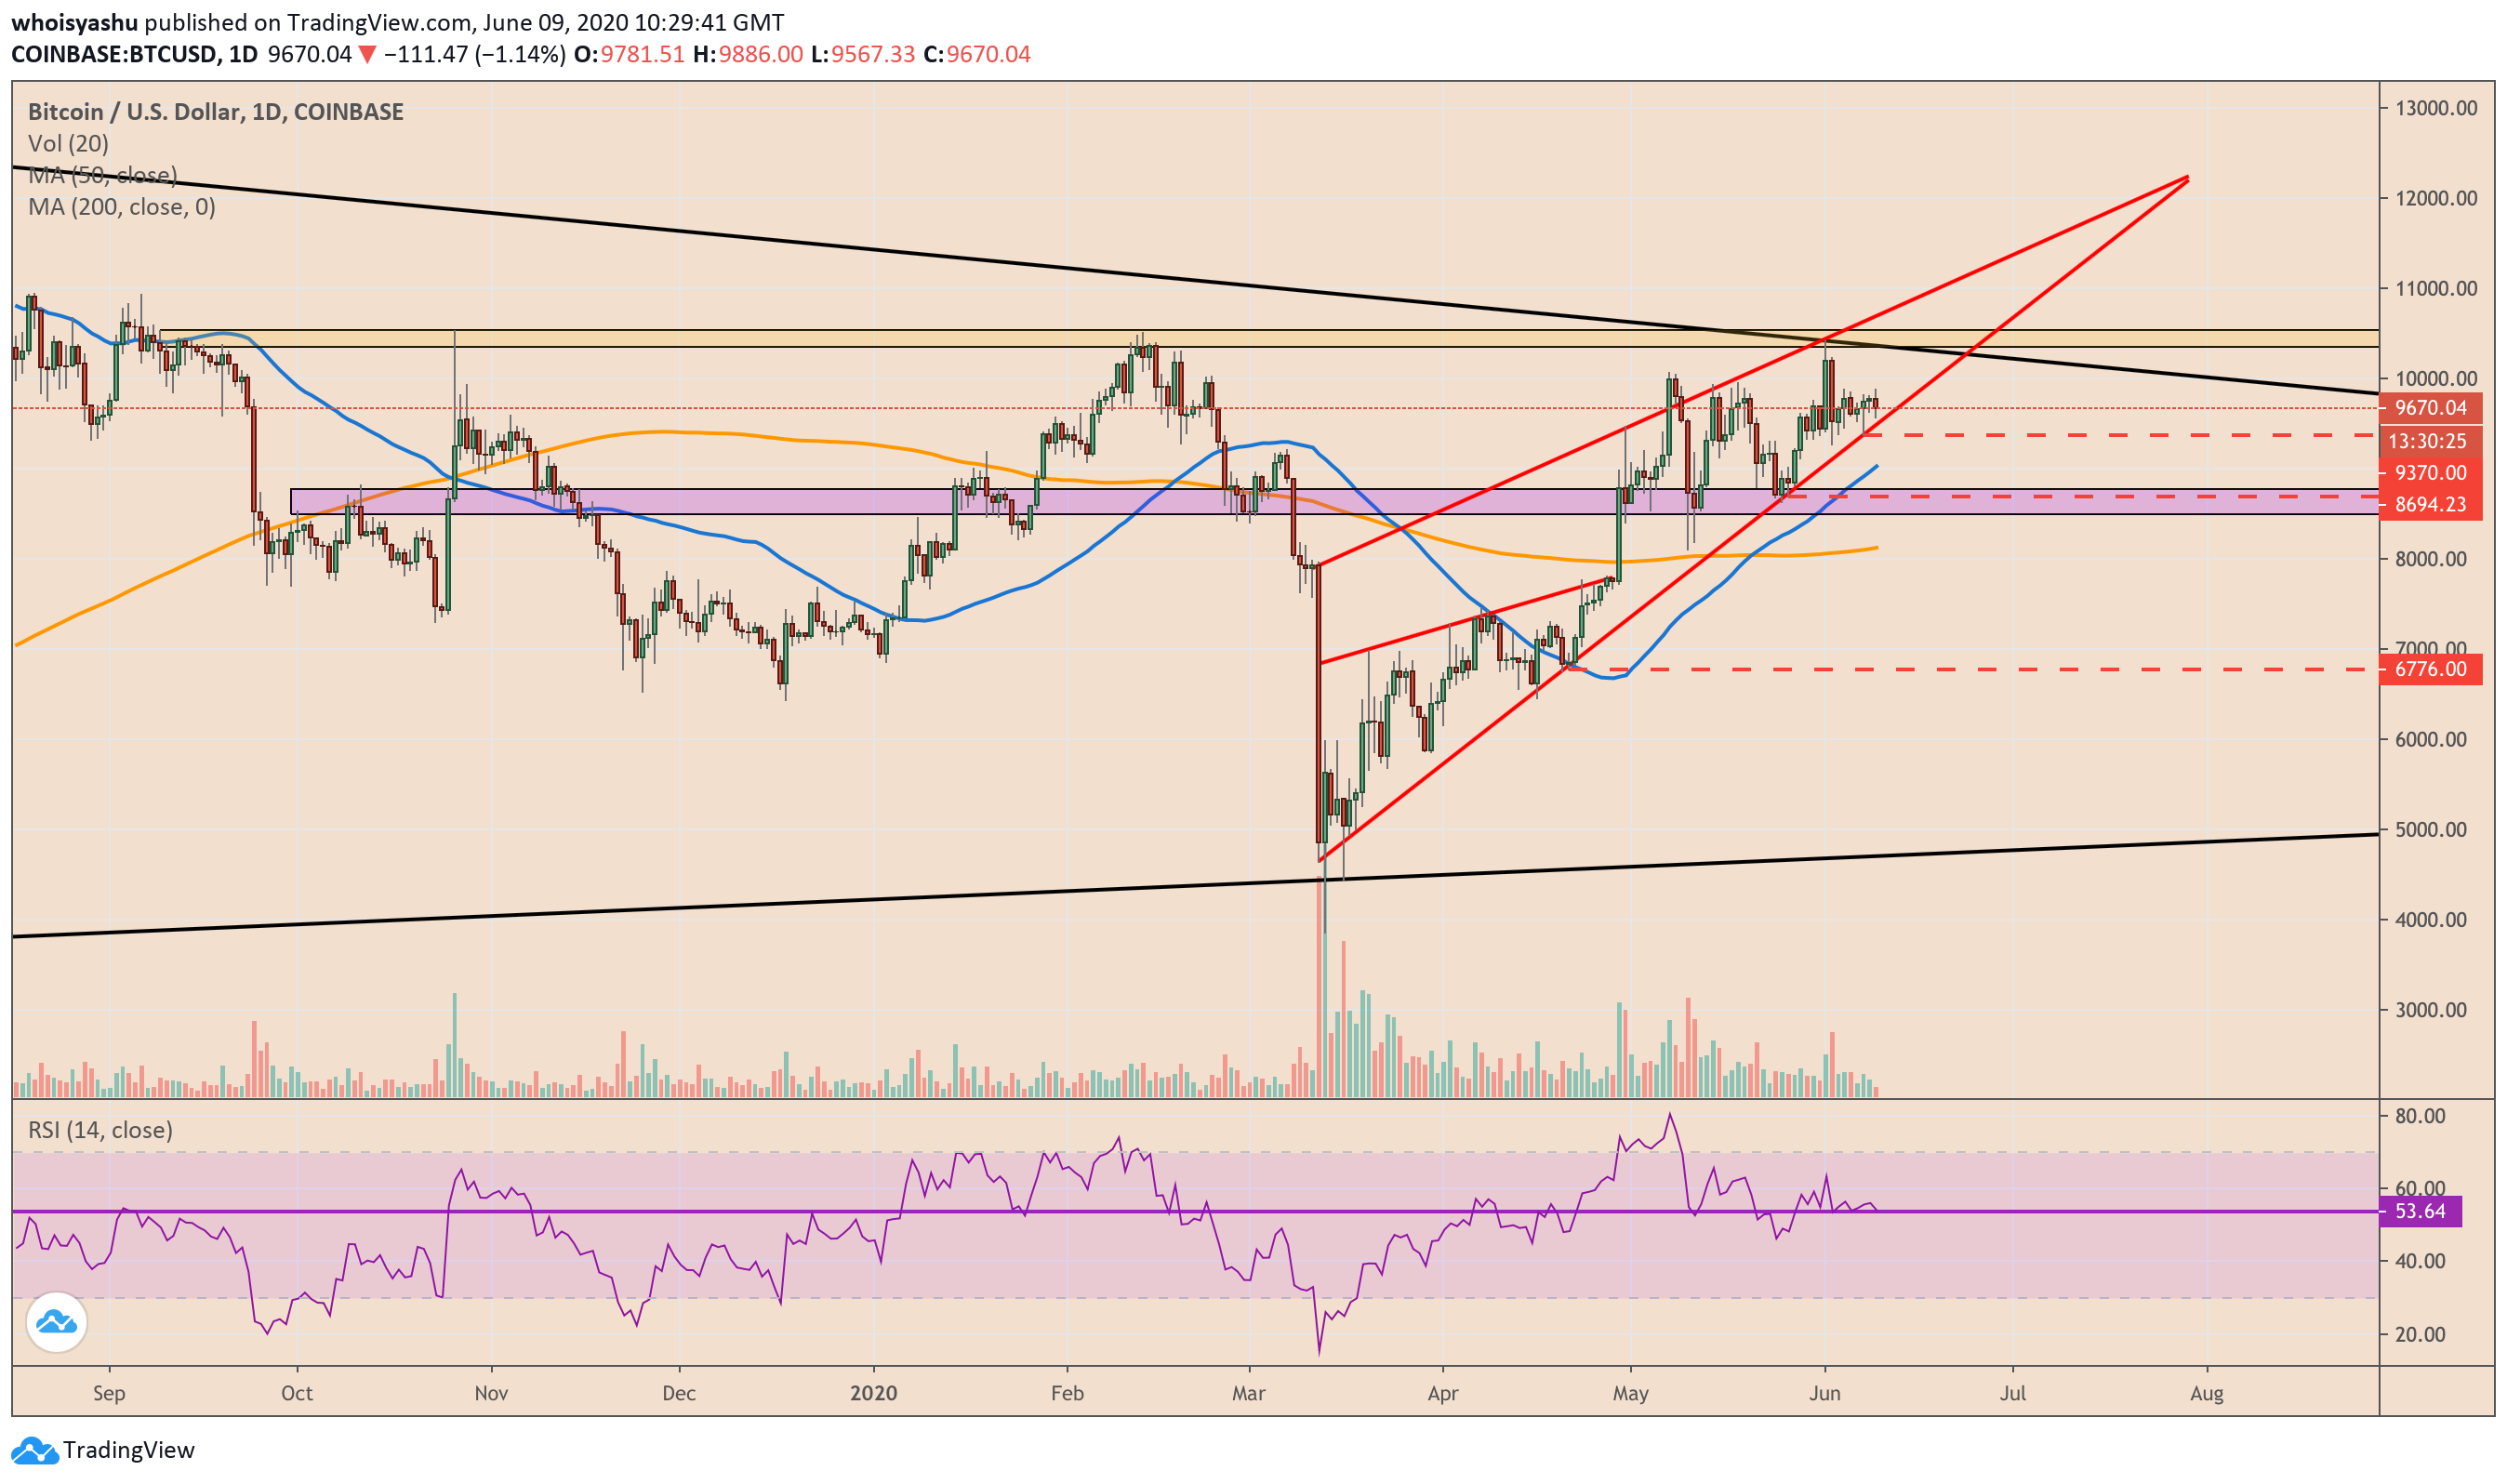
Failed Rising Wedge | Source: TradingView.com, Coinbase
Meanwhile, there are also possibilities of a failed Rising Wedge. Bitcoin earlier in April 2020 invalidated a similar pattern, as shown in the updated chart above. Instead of breaking down, the price broke bullish and rallied by up to 34 percent.
Part of the reason why a technical indicator can fail is strong fundamentals. Bitcoin rallied against the Federal Reserve’s decision to cut interest rates to near-zero and inject trillions of dollars into the U.S. economy. It also went up owing to its much-publicized “halving.”
The same fundamentals are still playing catalysts for the macro market trend. It means Bitcoin could head upwards despite a bull trap indicator, after all.


