

Bitcoin is up more than 2% today and it is trading above $9,500 against the US Dollar. BTC is trading in a positive zone and it could rally above the $9,800 and $10,000 resistance levels.
- Bitcoin is showing a lot of positive signs above the $9,500 pivot level.
- The price recovered nicely after a short term downside correction towards the $9,200 zone.
- There was a break above a key bearish trend line with resistance near $9,570 on the 4-hours chart of the BTC/USD pair (data feed from Kraken).
- The pair is likely to accelerate higher above the $9,800 as long as it is above the $9,300 support.
Bitcoin Remains In Uptrend
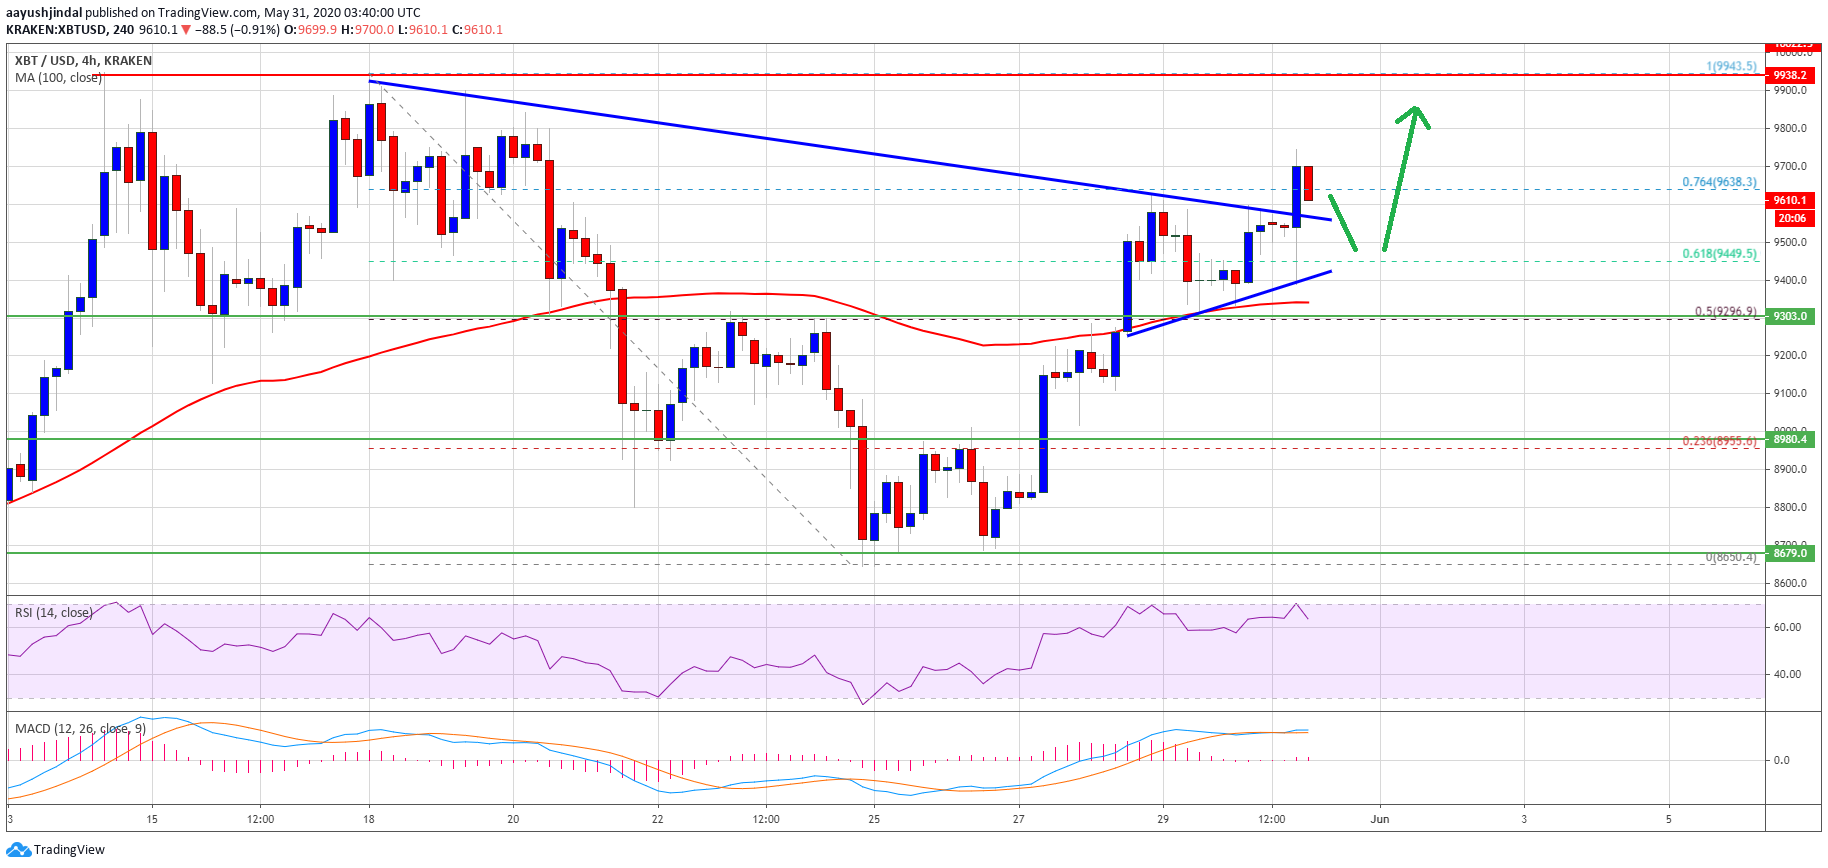
This past week, bitcoin popped higher and broke the $9,300 resistance area against the US Dollar. BTC price traded with a positive bias and settled above the $9,300 level and the 100 simple moving average (4-hours).
There was a minor downside correction from the $9,600 zone, but the same $9,300 area acted as a support. The price remained stable and traded above the 61.8% Fib retracement level of the key decline from the $9,943 high to $8,650 low.
Moreover, there was a break above a key bearish trend line with resistance near $9,570 on the 4-hours chart of the BTC/USD pair. Bitcoin is now trading nicely above the 76.4% Fib retracement level of the key decline from the $9,943 high to $8,650 low.
It seems like the price is likely to continue higher towards the $9,750 and $9,800 levels. The first major resistance is near the $9,950 and $10,000 levels. The next major hurdle for the bulls is near the $10,500 level, above which the price is likely to surge higher towards the $11,200 and $11,500 levels.
Dips Supported in BTC
In the short term, bitcoin price might correct lower below $9,600. An initial support is near the broken trend line or $9,580. The first key support is near the $9,430 level and a connecting bullish trend line on the same chart.
The main support is forming near the $9,300 level and the 100 simple moving average (4-hours). Any further losses may perhaps start a major decrease and the price might revisit the $9,000 level or $8,800.
Technical indicators
4 hours MACD – The MACD for BTC/USD is gaining pace in the bullish zone.
4 hours RSI (Relative Strength Index) – The RSI for BTC/USD is currently well above the 60 level.
Major Support Level – $9,300
Major Resistance Level – $9,950
Take advantage of the trading opportunities with Plus500
Risk disclaimer: 76.4% of retail CFD accounts lose money.

