Bitcoin price is holding an important support near the $11,230 level against the US Dollar. BTC is likely to rally above $11,500 as long as it is above the $11,000 pivot level.
- Bitcoin started a downside correction after it failed to clear the $11,600 resistance zone.
- The price is still trading well above the $11,000 pivot level and the 100 simple moving average (4-hours).
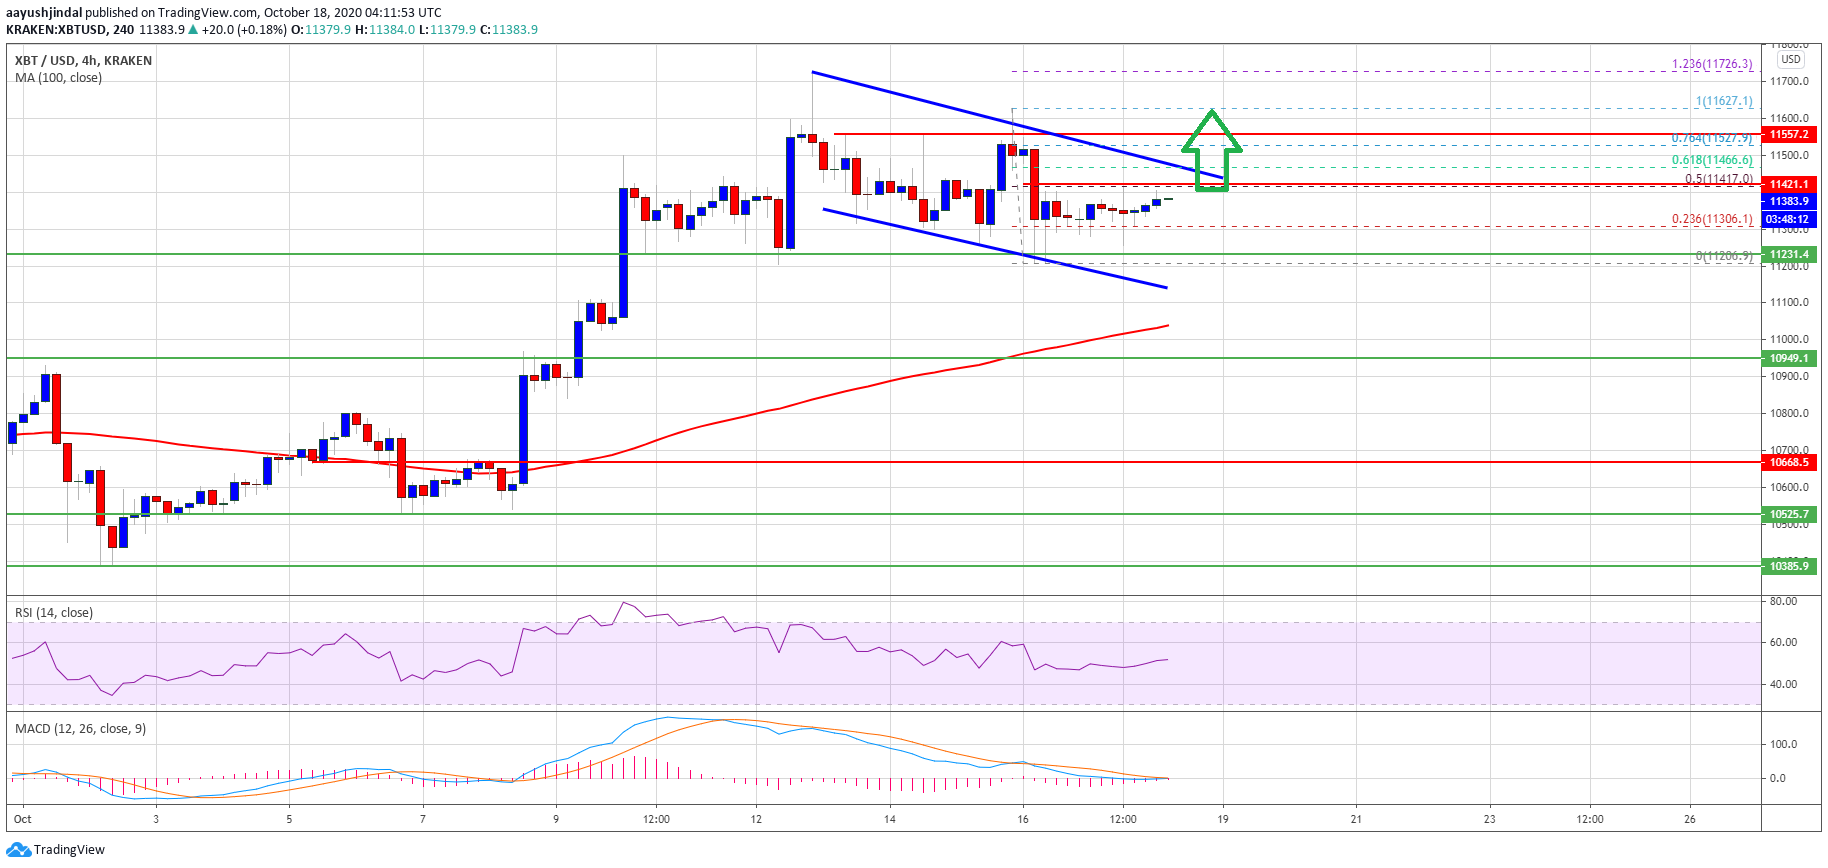
- There is a declining channel or a bullish flag pattern forming with resistance near $11,450 on the 4-hours chart of the BTC/USD pair (data feed from Kraken).
- The pair could start a strong upward move once it clears the main $11,450 and $11,500 resistance levels.
Bitcoin Holding Key Support
This past week, bitcoin attempted a fresh upside break above the $11,550 and $11,600 resistance levels against the US Dollar. However, the BTC/USD pair failed to gain traction above $11,600.
A high was formed near $11,627 before the price started a fresh decline. It broke the $11,500 support level and retested the main $11,200 support zone. A low is formed near $11,200 and the price is currently correcting higher.
There was a break above the $11,300 level. Bitcoin is still trading well above the $11,000 pivot level and the 100 simple moving average (4-hours). It surpassed the 23.6% Fib retracement level of the recent decline from the $11,627 high to $11,200 low.
Source: BTCUSD on TradingView.com
It seems like there is a declining channel or a bullish flag pattern forming with resistance near $11,450 on the 4-hours chart of the BTC/USD pair. An immediate resistance is near the $11,420 level since it is close to the 50% Fib retracement level of the recent decline from the $11,627 high to $11,200 low.
To start a fresh rally, the price must break the $11,420 level and the channel resistance. The next key resistance is near $11,500 level, above which the price might even surpass the $11,600 and $11,700 level. Any further gains could lead bitcoin towards the $12,000 resistance level.
Downsides Could Be Limited in BTC
If bitcoin fails to clear the channel resistance or $11,500, there is a risk of a fresh decline. The main support on the downside is near the $11,230 and $11,000 levels.
A downside break below the $11,230 and $11,200 support levels could start a sharp decline towards the $11,000 support (key resistance turned support).
Technical indicators
4 hours MACD – The MACD for BTC/USD is likely to move into the bullish zone.
4 hours RSI (Relative Strength Index) – The RSI for BTC/USD is now just above the 50 level.
Major Support Level – $11,200
Major Resistance Level – $11,450