

- Bitcoin price is currently in a downtrend below the $9,100 pivot level against the US Dollar.
- The price is trading well below the $8,500 support and the 100-day simple moving average.
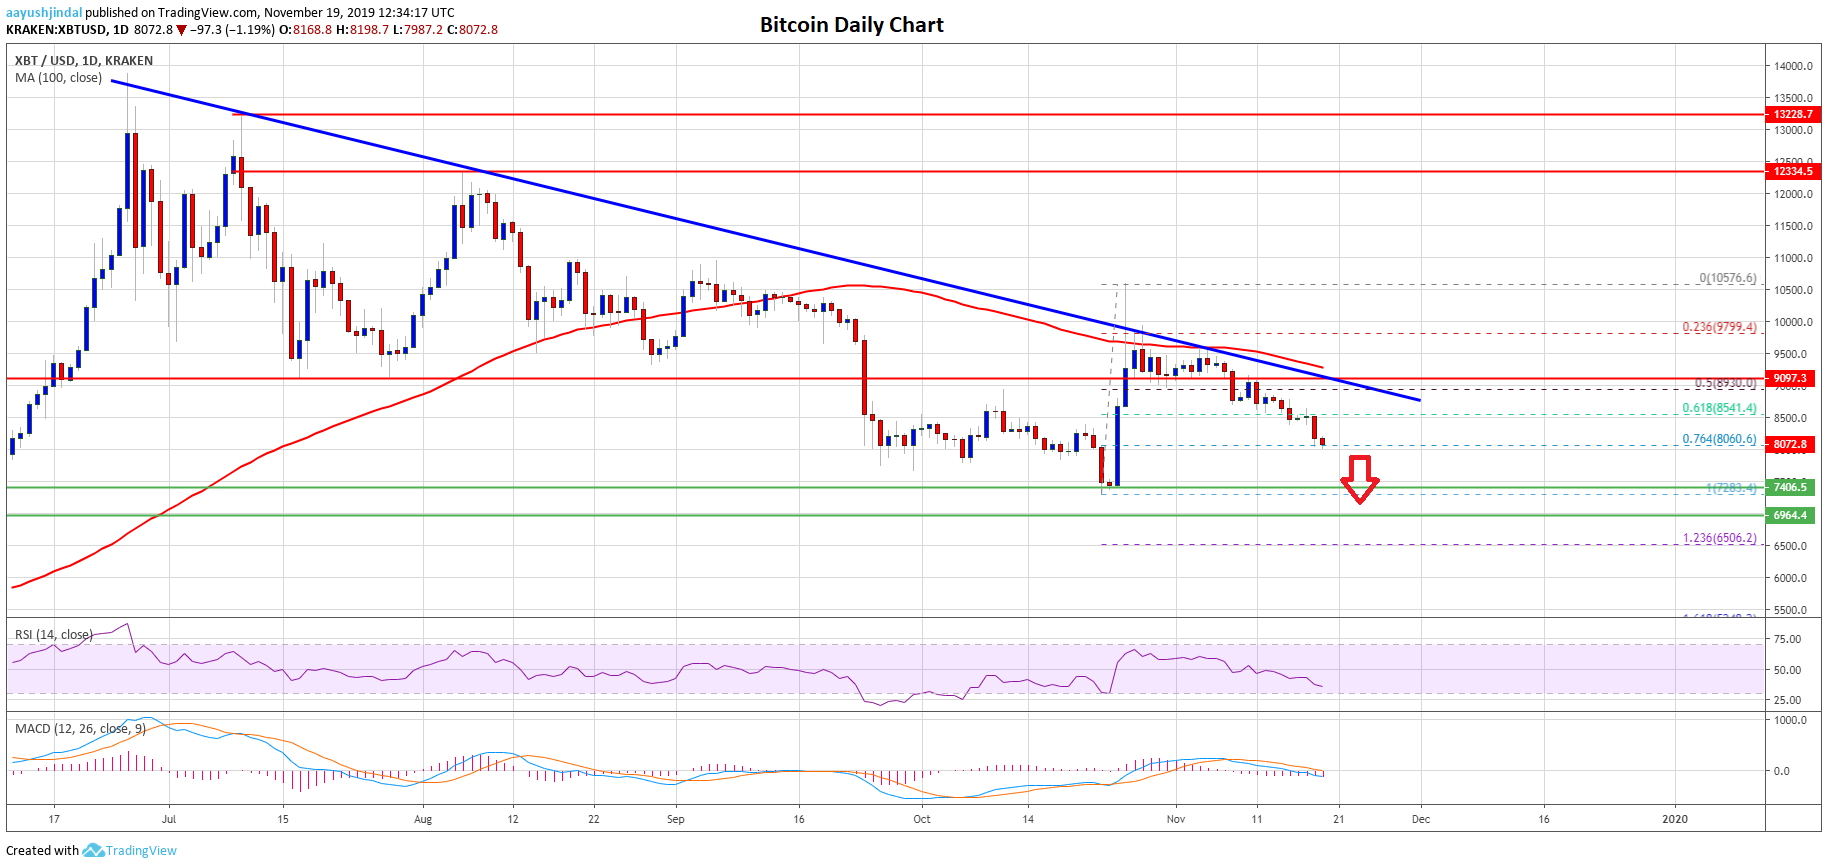
- There is a crucial bearish trend line forming with resistance near $8,880 on the daily chart of the BTC/USD pair (data feed from Kraken).
- If the current trend remains intact, the price could test $7,400 or even $6,500.
Bitcoin price is following a significant downtrend on the daily timeframe against the US Dollar. If BTC fails to stay above $7,400, it could hit the $6,500 support area.
Bitcoin Price Analysis (Daily Chart)
At the end of the October 2019, bitcoin started a sharp increase from the $7,283 low against the US Dollar. BTC surged above the $8,000 and $9,100 resistance levels. Moreover, there was a nasty spike above the $10,000 resistance area.
However, the price failed to settle above the $10,000 resistance and the 100-day simple moving average. A high was formed near $10,576 before the price started a fresh decline.
This month, the price lost almost all its gains and traded below the key $9,100 pivot level. Besides, the price broke the 61.8% Fib retracement level of the October’s rally from the $7,283 low to $10,576 high.
It is now trading well below the $8,500 support and the 100-day simple moving average. An immediate support is near the $8,060 level since it coincides with the 76.4% Fib retracement level of the October’s rally from the $7,283 low to $10,576 high.
If there is a downside break below the $8,060 and $8,000 support levels, bitcoin is likely to slide towards the $7,400 support area or the $7,283 low. In such cases, the price mostly breaks the last swing low ($7,283).
In the mentioned case, the price may perhaps test the $6,500 support. It represents the 1.236 Fib extension level of the October’s rally from the $7,283 low to $10,576 high.
On the upside, there are many resistances for the bulls, starting with $8,500. Additionally, there is a crucial bearish trend line forming with resistance near $8,880 on the daily chart of the BTC/USD pair.
Looking at the chart, bitcoin price is clearly following a nasty downtrend on the daily chart below $8,500 and $8,700. It is likely to test $7,400 or even $6,500 unless there is a daily close above the $8,880 resistance.
Technical indicators:
Daily MACD – The MACD is gaining pace in the bearish zone.
Daily RSI (Relative Strength Index) – The RSI for BTC/USD is currently moving lower and is well below the 40 level.
Major Support Levels – $7,400 followed by $6,500.
Major Resistance Levels – $8,500, $8,700 and $8,880.

