

- Bitcoin price surged higher and broke the main $10,000 and $10,200 resistances against the US Dollar.
- The price is currently consolidating below the next key resistance at $10,500-$10,525.
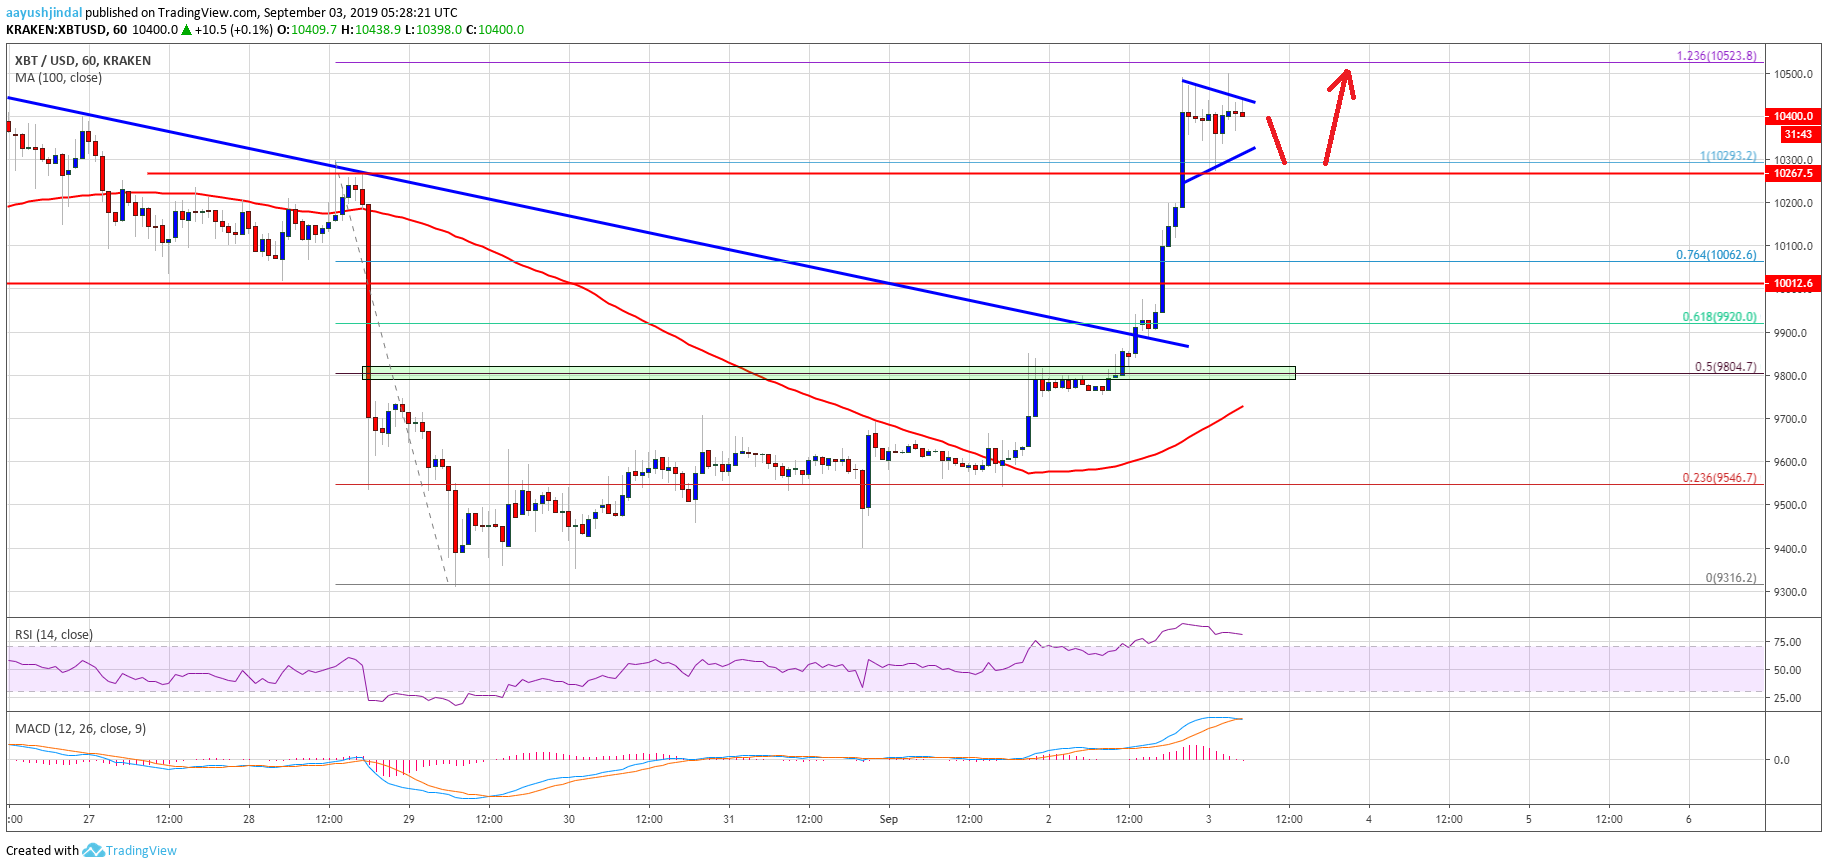
- This week’s followed key bearish trend line was breached with resistance near $9,880 on the hourly chart of the BTC/USD pair (data feed from Kraken).
- The price is currently trading in a range and dips are likely to find bids near $10,250 and $10,100.
Bitcoin price is up more than 7% above $10,400 against the US Dollar. BTC is now facing hurdles near $10,500 and it might correct lower in the short term.
Bitcoin Price Analysis
Yesterday, we discussed a few important hurdles for BTC near the $9,900 and $10,000 levels against the US Dollar. It seems like the bulls enjoyed a strong rally since the price surged above the $10,000 resistance level. Moreover, there was a close above the $10,200 resistance and the 100 hourly simple moving average. It helped many altcoins in staging a recovery, including Ethereum, binance coin, ripple and BCH.
During the rise, this week’s followed key bearish trend line was breached with resistance near $9,880 on the hourly chart of the BTC/USD pair. Moreover, the pair climbed above the 76.4% Fib retracement level of the downward move from the $10,295 high to $9,316 low. Finally, the pair broke the last swing high at $10,295 and traded above the $10,400 resistance area.
Bitcoin tested the next major resistance near the $10,500 level. Moreover, the 1.236 Fib extension level of the downward move from the $10,295 high to $9,316 low is near the $10,525 level. Therefore, a clear break above the $10,500 and $10,525 levels could push the price towards the $11,000 barrier in the near term. At the moment, the price is consolidating in a contracting triangle above $10,300 on the same chart.
If there is a downside break below the $10,350 and $10,300 levels, the price could test the $10,250 support area. The main support on the downside is near the $10,000 level (the recent resistance area). A close back below $10,000 might push the price back in a negative zone.
Looking at the chart, bitcoin price is clearly trading in a positive zone, with a close above $10,000 and $10,200. If the bulls succeed in gaining momentum above $10,500 and $10,525, the price is likely to rally another 5%-7% and trade towards the $11,000 resistance level.
Technical indicators:
Hourly MACD – The MACD is currently reducing its bullish slope.
Hourly RSI (Relative Strength Index) – The RSI for BTC/USD is correcting lower from the overbought levels.
Major Support Levels – $10,250 followed by $10,050.
Major Resistance Levels – $10,500, $10,525 and $10,800.


