

- Bitcoin price declined sharply below the $12,000 support area against the US Dollar.
- The price traded close to the $11,000 support and it is currently consolidating losses.
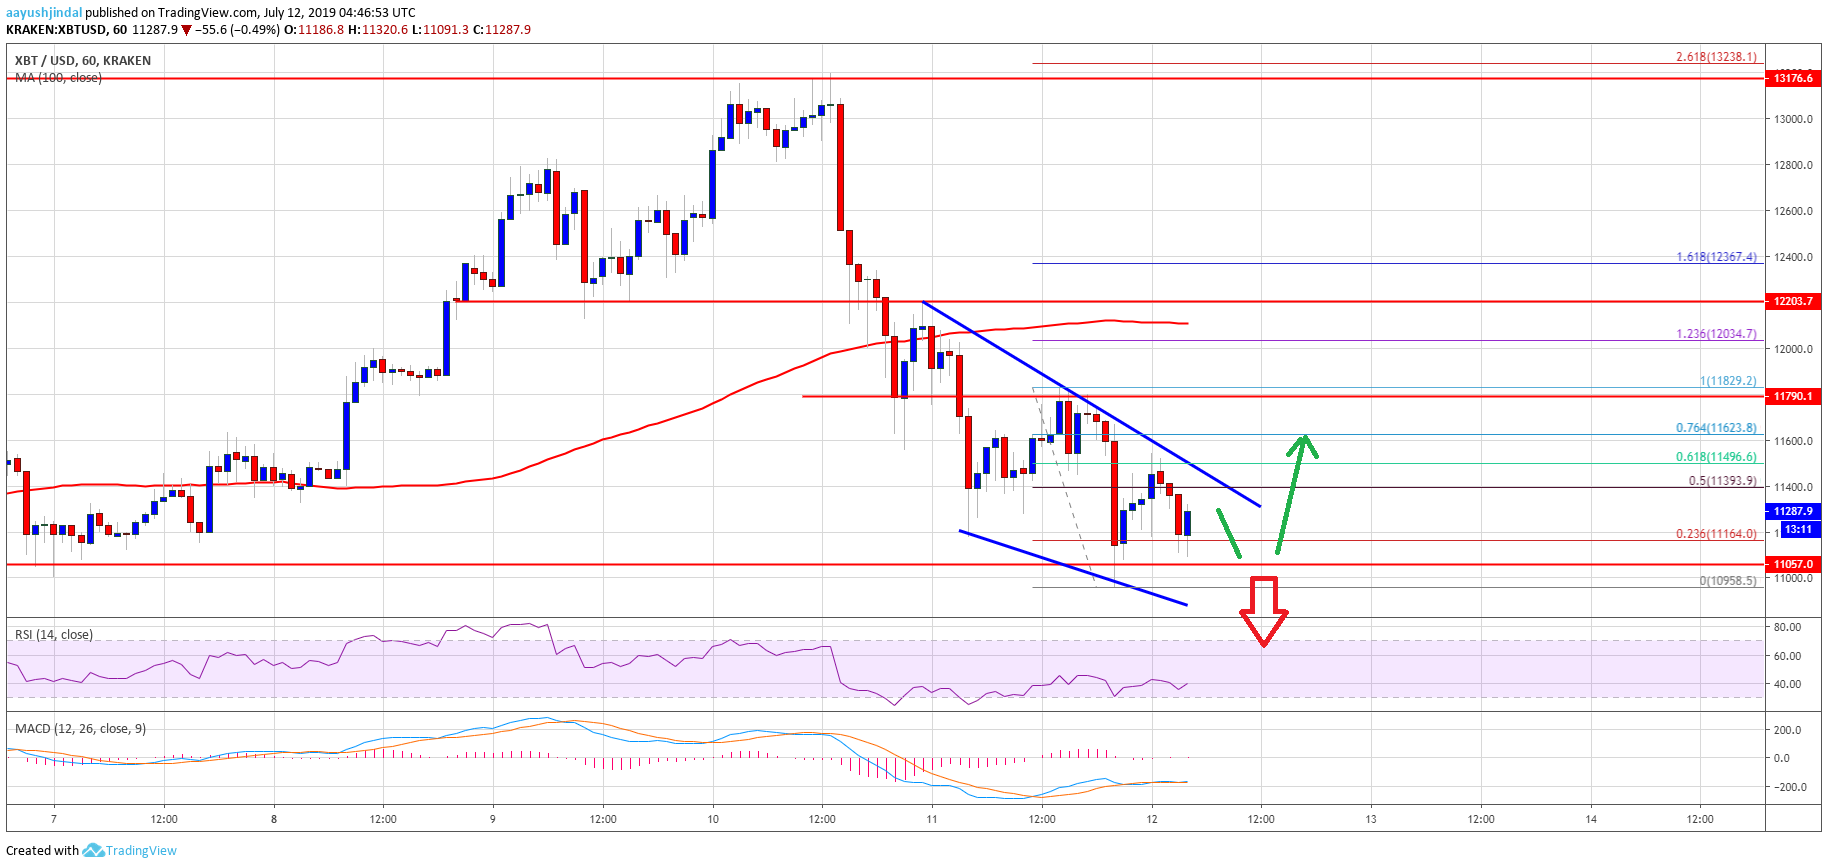
- There is a key bearish trend line forming with resistance near $11,400 on the hourly chart of the BTC/USD pair (data feed from Kraken).
- The price could either recover above $11,400 or it might extend losses below the $11,000 support.
Bitcoin price reached the key $11,000 support area against the US Dollar. BTC is currently consolidating and seems to be preparing for the next move either above $11,400 or towards $10,800.
Bitcoin Price Analysis
Yesterday, we saw a sharp decline in bitcoin price below the $12,000 support against the US Dollar. The BTC/USD pair even settled below the $12,000 support area and the 100 hourly simple moving average. Moreover, there was a break below the $11,800 support and the $11,500 pivot level. The price traded close to the $11,000 support and formed a new weekly low at $10,958. Similarly, there were heavy losses in Ethereum, BCH and ripple.
Recently, there was an upside correction above the $11,200 level. Moreover, the price broke the 50% Fib retracement level of the recent decline from the $11,829 high to $10,958 low. However, the upward move was capped by the $11,500 resistance level. The 61.8% Fib retracement level of the recent decline from the $11,829 high to $10,958 low also acted as a resistance.
At the outset, the price is consolidating losses above the $11,000 support level. On the upside, there is a key bearish trend line forming with resistance near $11,400 on the hourly chart of the BTC/USD pair. If there is an upside break above $11,400 and $11,500, bitcoin price could recover towards the $11,650 and $11,700 levels. However, the main resistance for the bulls is near the $11,800 level (the previous support).
Conversely, there could be more losses if there is no break above $11,400 and $11,500. The main supports on the downside are near $11,000 and $10,800. If there is a downside break below $10,800, the price may accelerate decline towards the $10,000 level.
Looking at the chart, bitcoin price seems to be preparing for the next move either above the $11,400 level or below the $11,000 support. As long as the price is trading above the key $10,800 support, there are chances of an upside correction above $11,500.
Technical indicators:
Hourly MACD – The MACD is slowly moving back in the bearish zone.
Hourly RSI (Relative Strength Index) – The RSI for BTC/USD is currently recovering and it could test the 45 level.
Major Support Levels – $11,000 followed by $10,800.
Major Resistance Levels – $11,400, $11,500 and $11,800.


