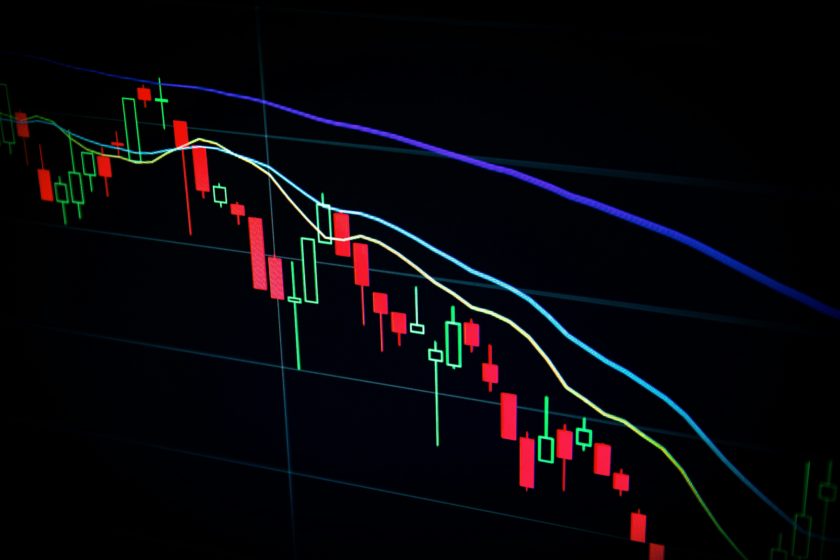
So far today the price of Bitcoin is down but still well over the $6,000 mark. The range so far is rather narrow. Perhaps, the price is consolidating before another move up or down.
Recent analysis
A recent analysis suggests that Bitcoin(BTC) is now trading in a tight range with neither bulls nor bears having the stronger hand. If the price moves decisively up or down this could set the stage for the next future trend.
A recent sell-off was expected to result in Bitcoin dropping below the $6,000 level over the weekend but the drop bottomed out on Saturday at a low of $6,119. More importantly, the cryptocurrency has printed higher price lows in the last four days, also signaling bearish exhaustion. However, something similar happened with lower price highs reaching around $6,400 so the bulls have nothing to cheer about either.
It is not clear in which direction there will be a breakout. Whichever direction the breakout takes should help determine the short term price trend.
Bitcoin was trading on Bitfinex at $6,320 a 0.5 percent gain over 24 hours at publish time.
Chart analysis
The hourly chart shows that the BTC price is squeezed between the two lines that represent lower highs and higher lows. Technical analysts call this a symmetrical triangle. A downside break of this range would add credence to the bearish pennant breakdown evident in the line chart and the rising wedge breakdown that can be seen in the candlestick chart Prices could then possibly drop below $6,000 the February low. If the break of the triangle is upward then there could be a strong corrective rally towards the 10-day moving average now located at $6,660.
On the daily chart both the 5-dy and 10-day moving averages (MA) show a downtrend a signal of a bearish trend. The bears will also be happy about the a rising wedge breakdown seen back on September 5.
The hourly chart favors a downside break but either side would end up winning for now.
The outlook
“The next violation of the narrowing price range on the hourly chart will likely set the tone for the next move in BTC. A break below $6,260 (lower end of the symmetrical triangle) would bolster the already bearish technical setup and open up downside towards $6,000 (February low). A move above $6,375 (upper edge of the triangle) would allow a corrective rally to the 10-day MA of $6,660, though the sustainability of gains is under question.”
Present situation
The price of BTC opened the day at $6,305. It has had a high so far of $6,390 past the $6,375 mark of the upper edge of the triangle. However, the low has been $6,190 below the lower end of the triangle. Yet no trend has been established as neither breakthrough was held. With just two hours to go in the day at 22:00 UTC the price of Bitcoin was $6,311 just marginally above the open. It is not clear yet which direction the price will go. Perhaps there will be a further period of consolidation before any larger move is made.


