
Bitcoin price volatility has crashed in the last 12 months as the bear market killed off the speculative frenzy.
Daily volatility, as represented by the spread between the price high and price low, stood at $61 yesterday – down a hefty 98 percent from the figure of $3,468 observed on Jan. 16, 2018 – according to CoinMarketCap data.
Meanwhile, BTC is currently down 74 percent from the $13,836 opening price posted on the same date last year. With a sharp drop in price, volatility in dollar terms trends to go down.
That said, volatility was extremely high in percentage terms. The cryptocurrency had witnessed a 26 percent move (high minus low divided by price) on Jan. 16, 2018, indicating that the cryptomarket frenzy was at its peak
Volatility, however, subsided as the year progressed: dropping from $973 in the first quarter to $345, $245 and $195, in the following quarters, respectively. Meanwhile, in percentage terms, average daily volatility fell from 9.14 percent to 3.6 percent over 2018.
This year has begun on a much more calm note. Daily volatility has remained largely below $200 and hit a 2.5-month low of $45.17 on Jan. 12. Many consider the slide in volatility a sign of speculative froth leaving the market and the cryptocurrency nearing a bottom.
It is worth noting that an extended period of low volatility usually ends up paving way for a big move. Therefore, BTC could soon violate the six-day-long trading range of $3,500 to $3,700.
Moreover, a range breakdown looks likely as the long-term technical charts are biased toward the bears. As of writing, BTC is changing hands at $3,585 on Bitstamp.
Weekly chart
As seen above, BTC fell 13 percent last week, reinforcing the bearish view put forward by the descending 10-week moving average, currently at $3,919.
The outlook remains bearish as long as BTC is held below the 10-week MA.
4-hour and daily chart
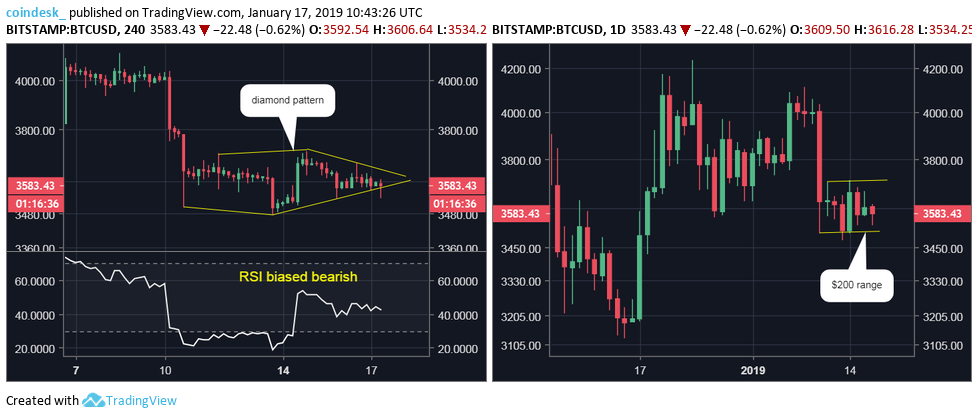
BTC has created a diamond pattern – a bearish continuation setup – on the 4-hour chart. A breakdown (4-hour close) below $3,575, if confirmed, would signal a resumption of the sell-off from the Jan. 10 high of $4,036 and could yield a deeper drop toward the December low of $3,122.
The relative strength index (RSI) is biased bearish at 41. So, there is plenty scope for a sell-off post-breakdown
Put simply, the prospects of BTC breaking the $3,700-$3,500 range to the downside would rise significantly if the diamond breakdown is confirmed.
View
- BTC is more likely to see a downside break of the $3,700-$3,500 range.
- $4,000 would be back on the table if BTC defies the bearish setup on the long term charts with a move above $3,700.
Disclosure: The author holds no cryptocurrency assets at the time of writing.
Bitcoin image via Shutterstock; price charts by Trading View