Bitcoin (BTC) closed the week up at $7,513 which was a 5.65% increase from the opening price of $7,111. It was a turbulent week with Bitcoin finding new lows for the quarter of $6,430, which invoked an impressive 16% bounce to close the week.
Bitcoin has continued to outperform the other cryptocurrencies, demonstrated by the 7-day performance for Bitcoin recording a 9.19% increase, whereas Ethereum’s Ether token (ETH) has barely moved, while XRP has lost around 5% of its value.
As such, there appears to be a disconnect developing between Bitcoin and the rest of the market.
Cryptocurrency market 7-day view. Source: Coin360
Bitcoin dominance is closing in on 70% without showing any sign of weakness. The vast majority of the gain in market share has come at the expense of Ethereum and XRP, which lost half their market share to Bitcoin. Put differently, BTC is up 104% for the year compared to Ether’s 2% and XRP, which is down 46%.

Cryptocurrency Market Cap Share. Source: Coinmarketcap
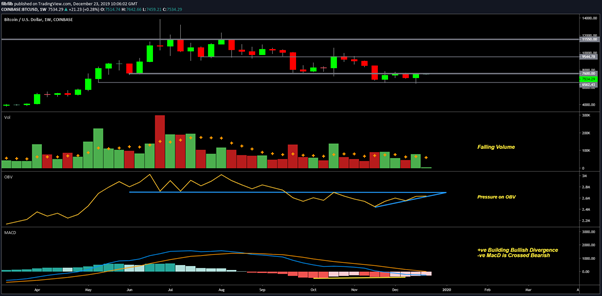
Weekly Chart
The 1-week Bitcoin chart shows Bitcoin trading within the full range between the mid-6 and 7,000s last week before finally closing hard up against resistance with a hammer candlestick, a bullish indicator.
The key weekly moving averages of the 50 and 100 remain crossed bullish, with the bulls now trying to reclaim the 50-week moving average (MA). Previous support at $7,600 will be a critical level to be reclaimed before BTC can be considered a bullish trade.

BTC USD Weekly chart. Source: TradingView
The Weekly On-Balance Volume, or OBV, indicator combined with the basic volume chart demonstrates that there has been a decline in the continued selling seen in the second half of the year, with the last two stand out volume candles pushing the price up rather than down.
The moving average convergence divergence indicator, or MACD, is also continuing to build on its bullish divergence but is likely to need another few weeks to achieve a bullish cross, which would be confirmed.
BTC USD Weekly chart. Source: TradingView
Monthly chart
A brief visit to the monthly chart as we roll into the final week of 2019 shows that Bitcoin is in the process of forming a bullish pin bar candle, which would be an interesting way to end the year should it be maintained, highlighting buying interest in the $6,000s.
The monthly chart again highlights the importance of the $7,600 level, which is also the monthly open for December.

BTC USD Monthly chart. Source: TradingView
1-day chart
The daily Bitcoin chart shows the strong 5% move into Sunday’s close, which finally broke the diagonal resistance that has held Bitcoin’s price down for all of December.
Bitcoin is now trading within a well-established volume node at $7,150 and $7,500, where profit taking and short interest appears to have been found as would be expected.
The key moving averages are also trending towards prices representing high levels of trading interest. A bullish breakout would likely be met by resistance at these levels, which are currently $8,200 for the 100 MA and $9,250 for the 200 MA.

BTC USD 1-day chart. Source: TradingView
The MACD indicator clearly shows a confirmed bullish divergence with the given indicator making higher lows after price found lower lows. The histogram continues to print higher highs recognizing the rate at which the MACD is reaching out towards its zero line, which would be a good indicator for a continuation of the market.
The RSI has also begun trending up over 50, which is also a confirmation of the bullish divergence that was also seen in this indicator.

BTC USD 1-day chart. Source: TradingView
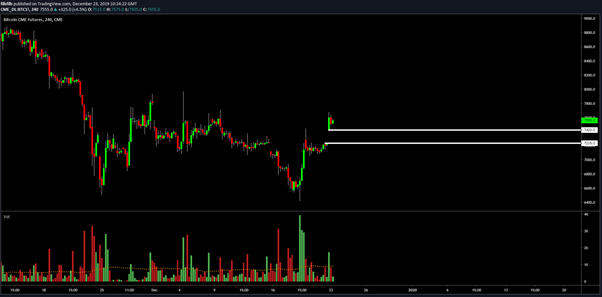
4-hour chart
Price on Monday appears to be stalling around the $7,550 level, which is to be somewhat expected given the known long-term resistance at this price point and will most likely define the final week in December.
The 4-hour CME chart shows that Bitcoin’s buying volume has been notably higher at the CME when compared to that of the spot market. The CME closed the week at $7,235 and now has a gap to the downside as a result of the 5% move on Sunday.
The recent CME gaps have been resolved within a week in recent times suggesting that a retest of the breakout from the middle of December’s trading range is likely.
BTC USD 4-hour chart. Source: TradingView
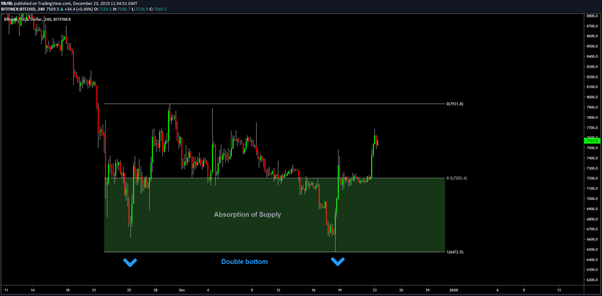
Accumulation
The 4-hour chart clearly reveals that Bitcoin is showing rejection of price below $7,000 with v-shaped reversals and long wicks into the $6,000 price range.
This goes some way to imply that the bulls are absorbing any supply in this price range and is similar to the Wyckoff double bottom schematic requirements.
A breakout of $8,200 would be a sign of strength printing a higher high, which is what is really required to declare that Bitcoin is bullish again 5 months before the halving event.
BTC USD 4-hour chart. Source: TradingView
Still in a downtrend
Despite a promising outlook for Bitcoin, the overwhelming trend is still to the downside following weeks of lower lows and lower highs. While the double-bottom and weekly candles are positive, double-bottoms are there to be broken and in a downtrend, the expectation would be that will be the case sooner or later.
There is also a question over how much absorption there will be by the bulls in the $6,000s and whether a deeper test of liquidity will occur — as well as for the bulls to demonstrate they are able to print higher highs.

BTC USD 1-day chart. Source: TradingView
Looking forward
Clearly, the final week of December is an important one. If the bulls maintain pressure on resistance, Bitcoin will finish the year up over 100%, clearly outperforming all other major cryptocurrencies and demonstrating another year of impressive gains.
A push by the bears to close a bearish December candle in the $6,000s would dampen some of the positive price action in 2019 and may open the doors for more downside in January 2020.
The views and opinions expressed here are solely those of the author and do not necessarily reflect the views of Cointelegraph. Every investment and trading move involves risk. You should conduct your own research when making a decision.