
Bitcoin rallied over 10% and it broke the key $10,500 resistance against the US Dollar. BTC is now trading nicely above $11,000 and it seems like the bulls are aiming a test of $12,000.
- Bitcoin extended its rally above the $10,000 and $10,500 resistance levels.
- The price traded to a new monthly high at $11,422 and it is currently consolidating gains.
- There is a major bullish trend line forming with support near $10,8s00 on the hourly chart of the BTC/USD pair (data feed from Kraken).
- The pair is likely to continue higher towards the $11,600 and $12,000 levels in the near term.
Bitcoin Price Gains Pace above $10,500
Yesterday, we saw a strong increase in bitcoin above the $10,000 resistance against the US Dollar. BTC extended its rally above the $10,200 and $10,500 resistance levels to settle above a couple of crucial hurdles.
There was a break above the $11,000 level and the price settled well above the 100 hourly simple moving average. A new monthly high is formed near $11,422 and it is currently consolidating gains. It corrected lower below the $11,200 level.
However, the 50% Fib retracement level of the recent rally from the $10,275 low to $11,422 high acted as a strong support near $10,850. There is also a major bullish trend line forming with support near $10,8s00 on the hourly chart of the BTC/USD pair.
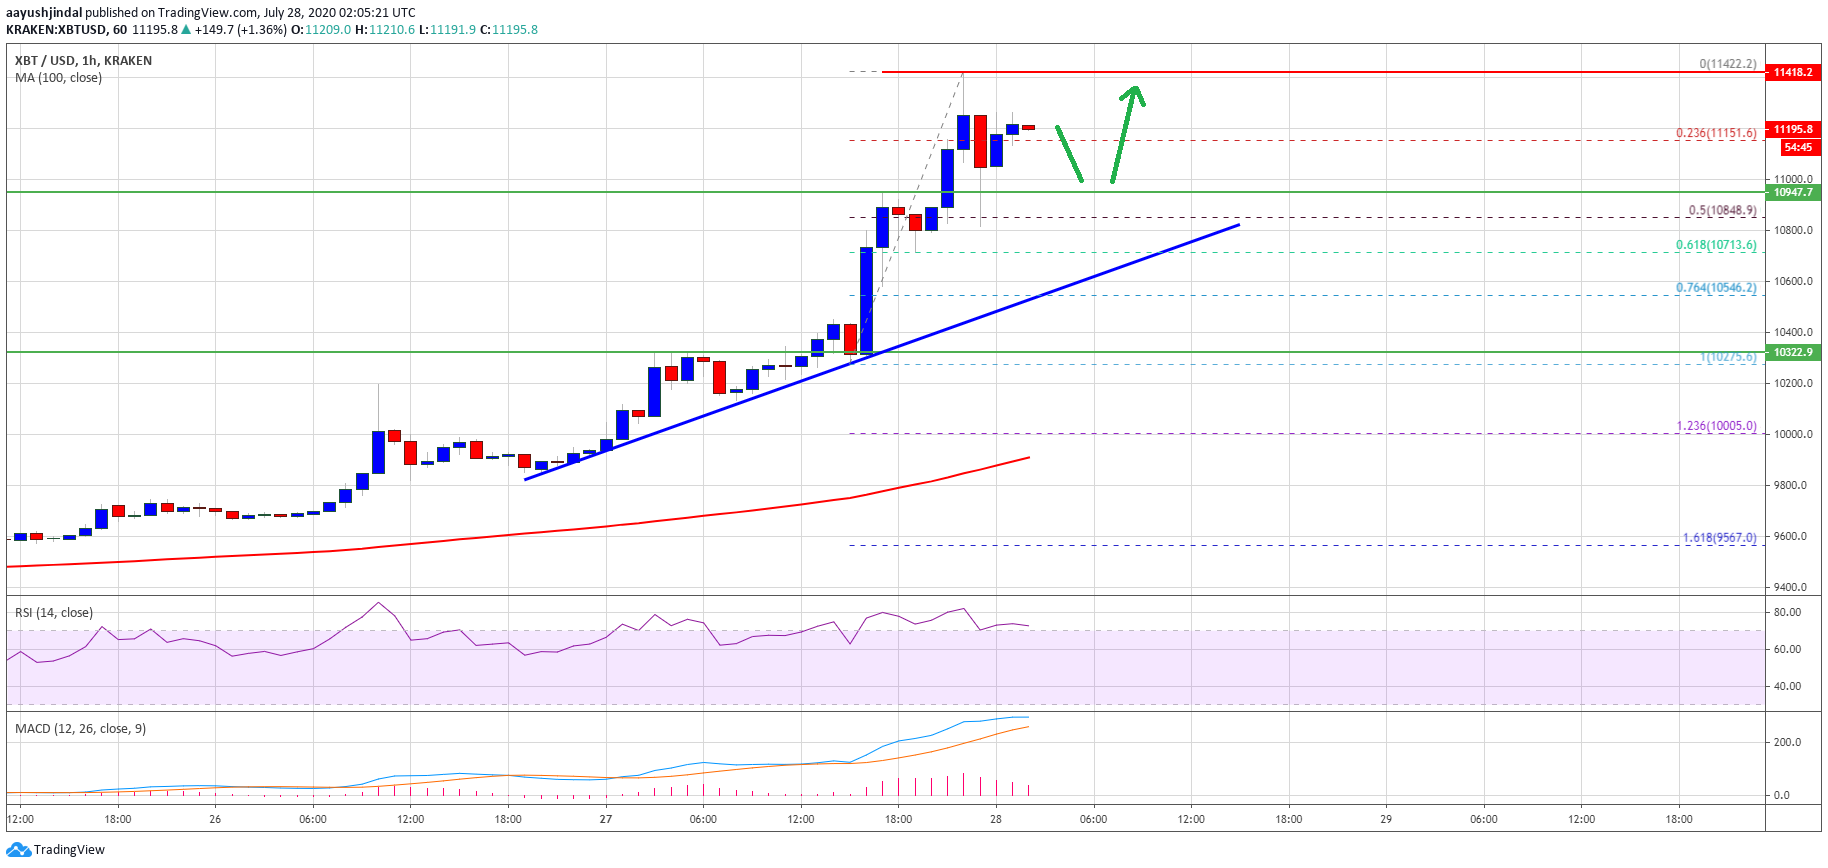
Bitcoin price rallies 12%. Source: TradingView.com
The trend line is close to the 61.8% Fib retracement level of the recent rally from the $10,275 low to $11,422 high. On the upside, the $11,500 level is a major hurdle for the bulls.
A successful break above the $11,400 and $11,500 levels may perhaps open the doors for sharp increase in the near term. The next target for the bulls could be $12,000 in the coming sessions.
Dips Likely Supported in BTC
If there is a downside correction, bitcoin is likely to find bids near the $11,000 and $10,800 levels. The main support is now near the trend line and $10,500.
Any further losses could lead the price towards the $10,300 support zone. The next major support is near the $9,800 level and the 100 hourly simple moving average.
Technical indicators:
Hourly MACD – The MACD is currently losing strength in the bullish zone.
Hourly RSI (Relative Strength Index) – The RSI for BTC/USD is now correcting lower from the 70 level.
Major Support Levels – $11,000, followed by $10,800.
Major Resistance Levels – $11,400, $11,500 and $12,000.