

Bitcoin gained traction and recently climbed above the $10,000 mark against the US Dollar. BTC price is now in a strong uptrend and it could soon test $11,560 or $12,100.
- Bitcoin price is showing a lot of positive signs above the $9,500 resistance area.
- The bulls were able to push the price above $10,000, opening the doors for a larger rally.
- There was a break above a crucial bearish trend line with resistance near $9,000 on the daily chart of the BTC/USD pair (data feed from Kraken).
- The pair is likely to continue higher towards the $11,000, $11,560 and $12,100 levels in the near term.
Bitcoin Price Could Soon Test $11,500
This month, bitcoin started a strong upward move above the $9,000 resistance area. Earlier, BTC was able to settle nicely above the $8,800 pivot level and the 100-day simple moving average.
It cleared the path for more gains above the $9,200 and $9,250 resistance levels. More importantly, the bulls were able to push the price the main $9,500-$9,600 resistance area.
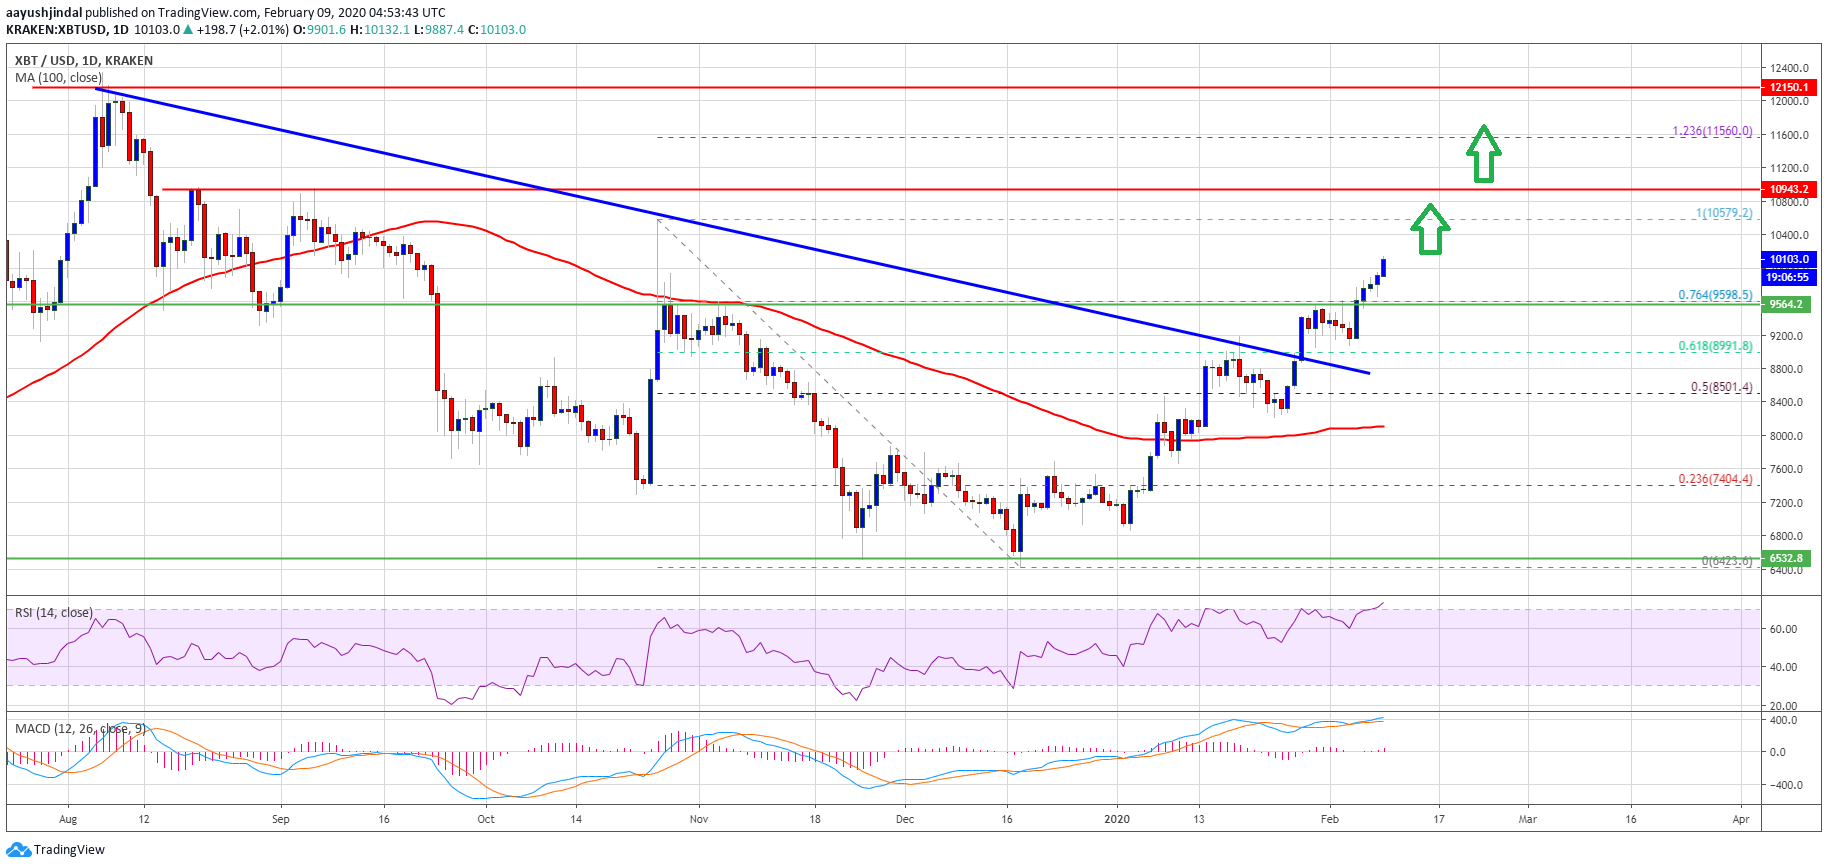
During the rise, there was a break above a crucial bearish trend line with resistance near $9,000 on the daily chart of the BTC/USD pair. Bitcoin even surpassed the 76.4% Fib retracement level of the last key decline from the $10,579 high to $6,423 low.
The price is now showing a lot of positive signs and it recently climbed above the $10,000 level. The next resistance is seen near the $10,579 swing high.
However, the first key resistance for the bulls may perhaps be near the $11,560 level. It represents the 1.236 Fib extension level of the last key decline from the $10,579 high to $6,423 low.
Any further gains could lead the price towards the $12,100 resistance level. The main target for the current wave could be near $13,000 since it is close to the 1.618 Fib extension level of the last key decline from the $10,579 high to $6,423 low.
Downside Correction in BTC?
The recent break above $9,500 and $10,000 was significant. It has opened the doors for a larger rally towards $11,500 and $12,000.
Therefore, the chances of a downside correction are very less. An initial support is near the $9,600 area (the recent breakout zone). Any further losses may lead bitcoin price towards the $9,000 support area.
Technical indicators:
Daily MACD – The MACD is slowly gaining momentum in the bullish zone.
Daily RSI (Relative Strength Index) – The RSI for BTC/USD is now well above the 65 level.
Major Support Levels – $9,600 followed by $9,000.
Major Resistance Levels – $11,560, $12,100 and $13,000.


