

Bitcoin is currently correcting higher from the $3,906 swing low against the US Dollar. BTC is now forming a crucial breakout pattern, which is likely to decide the next move.
- Bitcoin price seems to be facing a lot of hurdles on the upside near $5,500 and $5,950.
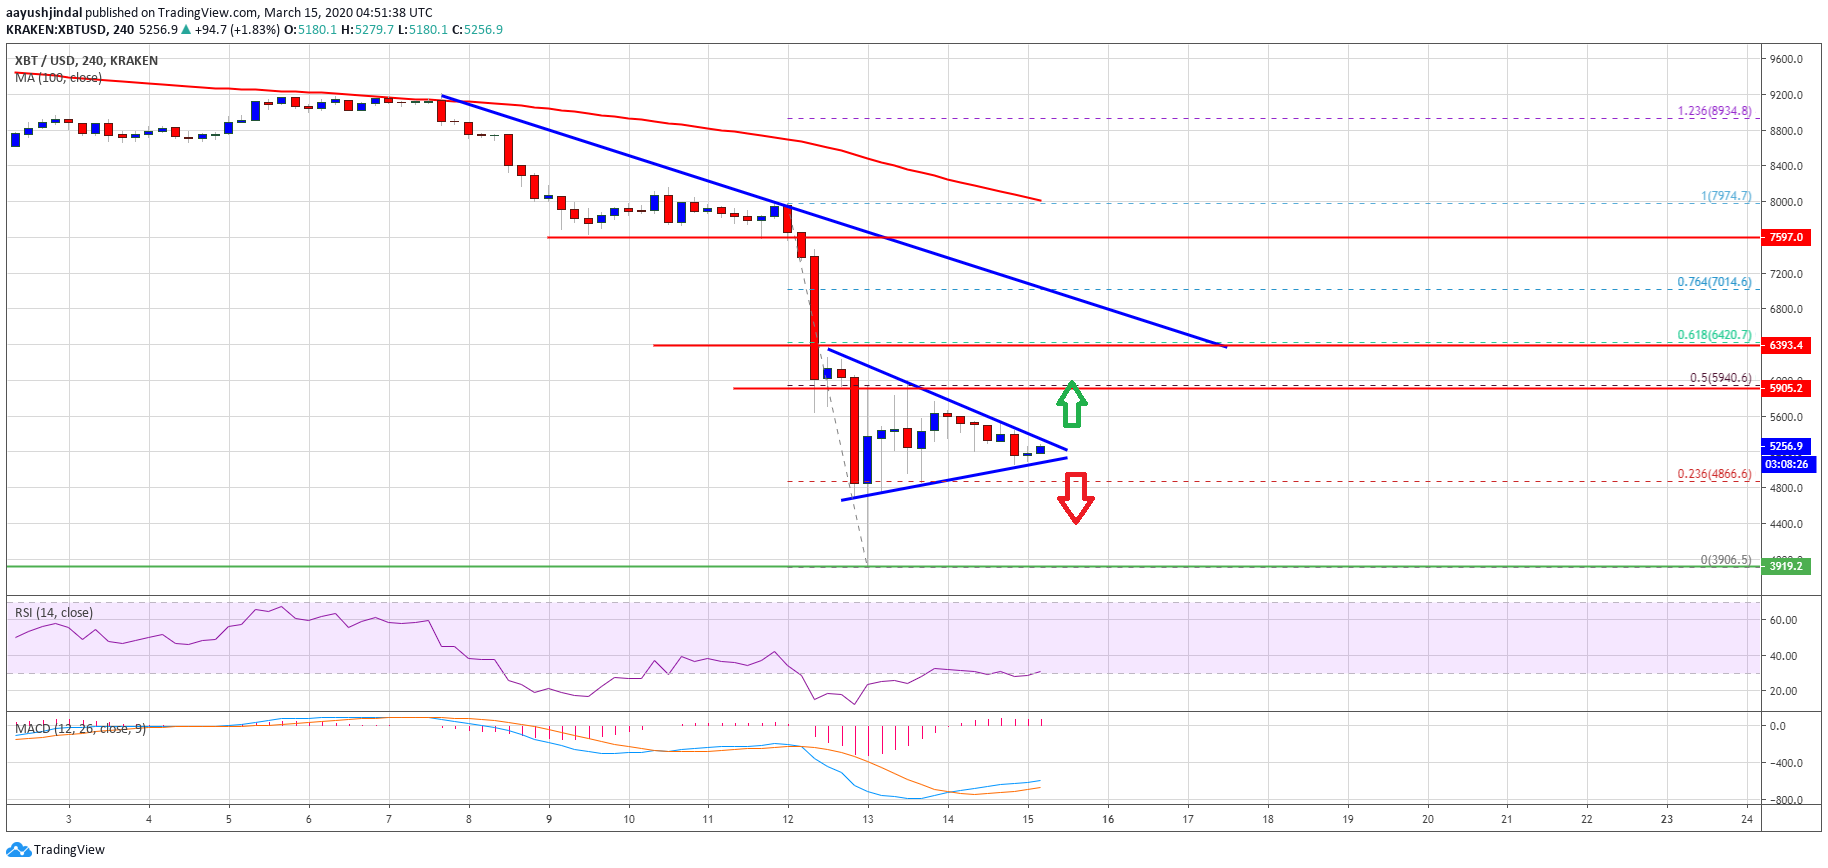
- The price is now trading well below $6,500 pivot area and the 100 simple moving average (4-hours).
- There is a crucial contracting triangle forming with resistance near $5,350 on the 4-hours chart of the BTC/USD pair (data feed from Kraken).
- The pair could either recover towards the $6,500 resistance area or it might start a fresh decline.
Bitcoin is Facing Hurdles
This past week, bitcoin saw a strong decline below the $6,000 and $5,000 levels against the US Dollar. BTC price even spiked below the $4,200 support level and settled well below the 100 simple moving average (4-hours).
A new multi-month low is formed near the $3,906 level and the price is currently correcting higher. It recovered losses and climbed above the $4,500 and $5,000 resistance levels. Besides, there was a break above the 23.6% Fib retracement level of the key drop from the $7,974 high to $3,906 low.
Bitcoin bulls were able to push the price above the $5,500 resistance level. However, the $6,000 resistance area acted as a strong barrier for the bulls. The 50% Fib retracement level of the key drop from the $7,974 high to $3,906 low is also acting as a key resistance.
At the moment, there is a crucial contracting triangle forming with resistance near $5,350 on the 4-hours chart of the BTC/USD pair. If the pair breaks the triangle resistance, it could revisit the $6,000 resistance area.
The main resistance is waiting near the $6,450 and $6,500 levels. There is also a connecting bearish trend line forming with resistance near $6,450 on the same chart.
To start a fresh increase and a convincing recovery, the price must surpass the $6,000 resistance and then gain pace above the $6,500 barrier.
More Downsides?
If bitcoin price fails to climb above $5,500 or $6,000, there is a risk of another bearish break. A clear move below the $5,000 and $4,850 levels is likely to open the doors for more losses.
An initial support is near the $4,200 level, below which the price might retest $4,000. Any further losses could set the pace for a move towards the $3,600 level.
Technical indicators
4 hours MACD – The MACD for BTC/USD is about to move back into the bearish zone.
4 hours RSI (Relative Strength Index) – The RSI for BTC/USD is currently just above the 30 level.
Major Support Level – $4,850
Major Resistance Level – $6,000


