- Bitcoin has pulled back from seven-week highs above $8,400, but the bullish breakout confirmed on Jan. 6 is still valid.
- The price drop was backed by low seller volumes and may be reversed.
- The bullish case would weaken if prices find acceptance under key support at $7,567.
Bitcoin has pulled back from multi-week highs but is still hovering in bullish territory above key support near $7,600.
The number one cryptocurrency is currently trading at $7,910 – down 6.5 percent from the seven-week high of $8,463, according to CoinDesk’s Bitcoin Price Index (BPI).
The
pullback began during the U.S. trading hours on Wednesday with gold and other safe
havens losing ground on easing of geopolitical tensions.
“Bitcoin’s price dropped down to $8,100 (from $8,300-$8,400 range) right as President Trump announced at 11 a.m. ET that the U.S. will not escalate the conflict with Iran,” Hong Kim, co-founder and chief technology officer at Bitwise Asset Management tweeted Wednesday.
Popular analyst Ran NeuNer also put out a tweet, drawing attention to the fact that both bitcoin and gold moved lower following President Trump’s speech.
Bitcoin has moved in tandem with gold since Friday. The cryptocurrency turned higher from lows near $6,850 on Friday after the U.S. attacked Iran and clocked seven-week highs during the Asian trading hours on Wednesday. During the same time frame, the yellow metal rose from $1,530 to 6.5-year highs above $1,611.
So, it appears as though markets are beginning to treat the cryptocurrency as a haven asset, as noted by NeuNer.
That makes bitcoin vulnerable to a deeper pullback in gold, which is currently trading at $1,547 per Oz, representing a 4 percent drop from Wednesday’s high of $1,611.
The
yellow metal could slip further, possibly dragging bitcoin lower, as the
European equities (risk assets) are flashing green and the futures on the
S&P 500 are adding 0.33 percent.
That said, bitcoin’s short-term bias will remain bullish as long as prices are holding above key support near $7,600.
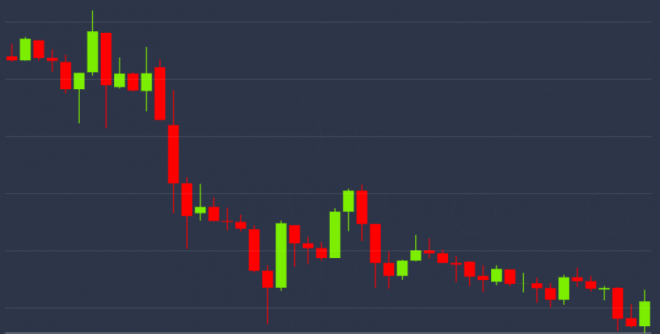
Daily chart
Bitcoin is flashing red for the second day. However, the former resistance-turned-support of the inverse head-and-shoulders, currently at $7,567, is intact.
So,
the bullish breakout confirmed on Jan. 6 is still valid and the path of least resistance
remains to the higher side.
Healthy pullback?
Markets usually crowd out weak hands (traders with limited ‘HODLing’ power) by revisiting former hurdle-turned-support before building on a major breakout.
Bitcoin
jumped 5 percent on Tuesday, confirming an upside break of the six-month-long
falling channel. The channel breakout signaled a revival of the bull market
from lows near $4,100 seen in April 2019.
Therefore, the 6 percent pullback could be the market’s attempt to shake out weak bulls. Also, trading volumes have dropped over the last 18 hours.
Hourly chart
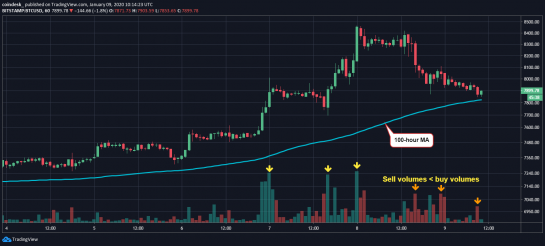
The price decline is accompanied by a slide in volumes. The red bars, representing selling volumes, have been small compared to the green bars or buying volume witnessed earlier this week.
A low-volume price drop is often short-lived.
The probability of a slide to the crucial daily chart support of $7,567 would increase if prices find acceptance below the 100-hour average at $7,825 on the back of strong volumes.
Disclosure: The author does not currently hold any digital assets.
Disclosure Read More
The leader in blockchain news, CoinDesk is a media outlet that strives for the highest journalistic standards and abides by a strict set of editorial policies. CoinDesk is an independent operating subsidiary of Digital Currency Group, which invests in cryptocurrencies and blockchain startups.