
View
- Bitcoin dropped 9.3 percent yesterday on the back of high volumes, invalidating the triangle breakout witnessed last Monday.
- A UTC close below $3,714 today would validate Sunday’s bearish outside reversal candle and open the doors to levels below $3,400.
- The longer duration charts are signaling bearish exhaustion, however, and any drop to $3,400 or below could be short-lived.
- A move above $4,190 (previous day’s low) is needed to revive the bullish outlook.
Bitcoin (BTC) nosedived overnight, clouding the interim bullish outlook, and a deeper drop could unfold if key support near $3,700 is breached.
The leading cryptocurrency by market capitalization rose to highs near $4,200 in the Asian trading hours yesterday, as expected, only to fall back to levels below $3,800 by UTC close. That 9.31 percent slide is the biggest single-day drop since Jan. 11.
Notably, trading volumes across all cryptocurrency exchanges totaled $10.79 billion on Sunday – the highest since April 25, 2018, according to CoinMarketCap.
The high-volume sell-off erased gains seen over the previous five days, thereby weakening the bullish case put forward by last Monday’s break above $3,800.
That said, a bullish-to-bearish trend change would be confirmed only if the sell-off seen yesterday is extended to levels below $3,700. Further, the losses following a potential bearish reversal could be short-lived, as signs of seller exhaustion have emerged on longer duration charts.
As of writing, BTC is changing hands at $3,780 on Bitstamp, representing a 7.78 percent drop on a 24-hour basis.
Daily chart
As seen above, BTC created a widely-followed candlestick pattern called “bearish outside-day” yesterday – invalidating the triangle breakout seen on Feb. 18.
A bearish reversal would be confirmed if prices close today (UTC) below $3,714 (Sunday’s low). That could yield a drop toward the recent lows below $3,400.
4-hour chart
The probability of BTC closing today below $3,714 would rise if the pennant pattern seen on the 4-hour chart is breached to the downside.
A break below the lower edge of the pennant, currently at $3,740, would confirm a breakdown and could be followed by a sell-off to $3,360 (target as per the measured move method).
BTC, however, may rise back to $4,000 if the pennant is breached to the higher side.
Weekly chart
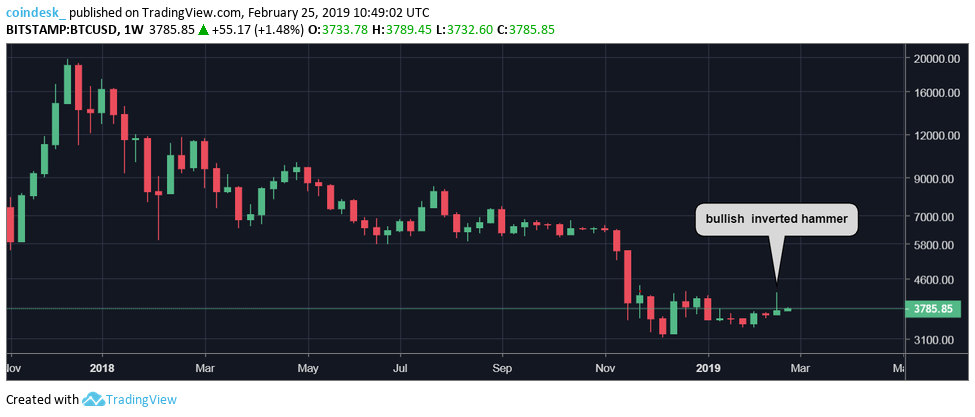
The inverted hammer seen in the above chart indicates that the buyers managed to eke out gains last week despite the sell on the rise mentality.
Put simply, the bulls are beginning to test bear’s strength, which is a sign the market is bottoming out.
As a result, sellers need to be cautious even if prices break below $3,700 today, as the ensuing losses could be short-lived.
Disclosure: The author holds no cryptocurrency assets at the time of writing.
Bitcoin image via Shutterstock; charts by Trading View