
View
- Bitcoin’s six-day-long consolidation near $3,600 has neutralized the bullish view put forward by a falling wedge breakout confirmed on Feb. 8. The follow-through to that bullish breakout has been extremely weak with prices unable to challenge the highs above $3,700 hit last Friday.
- A move above $3,711 (Feb. 8 high) would validate the bullish outside reversal candle seen in the 3-day chart and open the doors to the psychological hurdle of $4,000. That looks likely as BTC has witnessed another falling wedge breakout on the 4-hour chart.
- Bitcoin risks falling to $3,400 if the latest wedge breakout fails and prices find acceptance below $3,531 (wedge low).
Bitcoin’s (BTC) six days in the doldrums has weakened the bull case in the short term, leaving a target of $3,700 for a resumed rally.
The leading cryptocurrency by market capitalization was expected to make a quick move to the psychological resistance of $4,000, having witnessed a falling wedge breakout last Friday on the back of strong volumes.
BTC, however, has remained directionless near $3,600 in the last six days and is currently trading largely unchanged on the day at $3,570 on Bitstamp.
So weak has been the follow through to the wedge breakout that prices have failed to challenge even the highs above $3,700 seen last Friday. The immediate outlook, therefore, is neutral and $3,711 (Feb. 8 high) is the new level to beat for the bulls.
A convincing move above that resistance would put the focus back on the high volume falling wedge breakout and open the doors for a stronger corrective rally.
The bears may feel tempted to hit the market with fresh offers if the sideways action continues over the weekend, which could push price toward $3,400.
3-day chart
BTC created a bullish outside reversal candle on Feb. 8, meaning the price action seen during that three-day period engulfed the highs and lows of the preceding three days.
As the name implies, that candlestick is widely considered an early sign of bullish reversal. The trend change, however, is only confirmed after prices find acceptance above the high of that candlestick pattern.
A move above $3,711 (Feb. 8 high) would confirm a short-term bearish-to-bullish trend change and open the doors to levels above $4,000.
4-hour chart
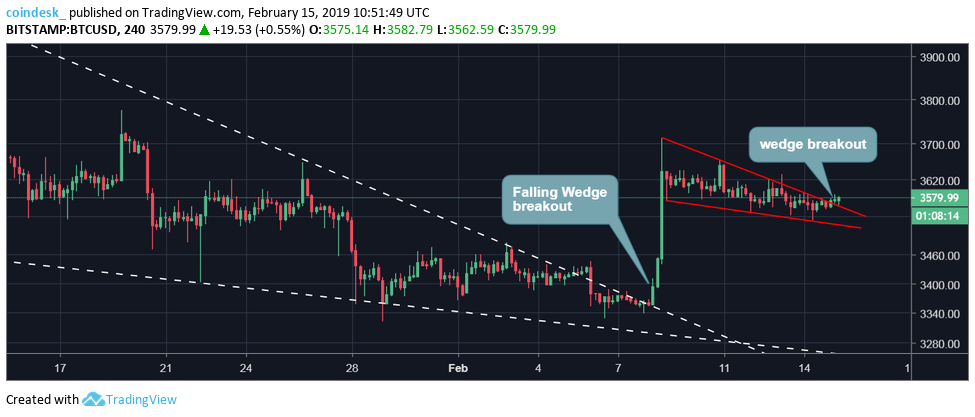
On the 4-hour chart, BTC is currently trading above the upper edge of the falling wedge – a breakout indicating a resumption of the rally from lows below $3,400 seen on Feb. 8. The positive move means BTC could confirm the bullish outside reversal with a move above $3,711 over the weekend.
The bears will likely capitalize and drive prices back toward $3,400 if the breakout fails and prices move below $3,531 (wedge low).
Disclosure: The author holds no cryptocurrency assets at the time of writing.
Bitcoin image via Shutterstock; charts by Trading View