Altcoins got crushed in their respective BTC pairs as Bitcoin (BTC) price decided to break out of the two-month-old range and reach as high as $11,400.
However, some altcoins did relatively well and a few top-10 cryptocurrencies showed strength while the price of Bitcoin was climbing. These included EOS (EOS), Litecoin (LTC) as well as XRP (XRP), which also showed strength by reaching a price level of $0.23.

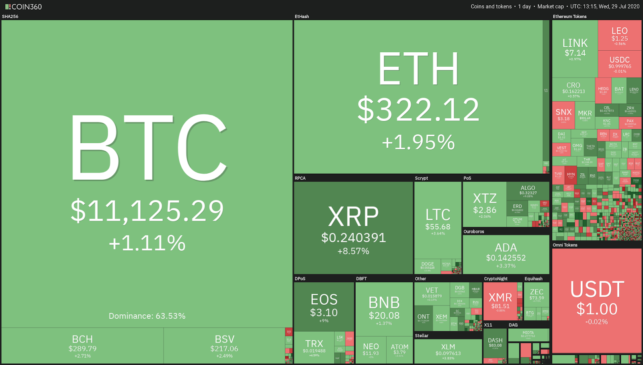
Crypto market daily performance. Source: Coin360
XRP breaks through 100-day and 200-day moving averages
The USDT pair of XRP is showing substantial strength as it broke above the $0.20 level. Aside from the $0.20 level, XRP price also broke above the 100-day and 200-day moving averages (MAs) and shows signs of bullish momentum.

XRP/USDT 1-day chart. Source: TradingView
The chart is showing a clear higher-low previously, which is essentially one of the cornerstones of upward momentum. The price is now making a higher high as it broke through the previous high at $0.22800.
What’s next for XRP?
Mostly, as long as it sustains support above the 100-day and 200-day MAs, it’s in bull territory, and dips should be considered as potential buy opportunities.
These MAs are must-hold levels as they also include a support range. This support range can be found between $0.204-0.21. As long as XRP sustains support above this level, continuation is likely towards the next resistance.
This resistance is located between $0.265-0.275 and some resistance should be expected, if not a rejection, in this area for XRP.
Will XRP retrace before continuation?

XRP/USDT 4-hour chart. Source: TradingView
It’s doubtful to see a continuation of the resistance zone in one-go. Therefore, based on the smaller timeframes, it’s more likely to see a corrective move before further upwards continuation.
The next levels to watch are those that have not been tested yet. In every upward and downward movement, levels are frequently tested before continuing. For instance, Bitcoin broke above $10,200, but it’s very likely to expect a correction toward that particular level to confirm whether buyers are stepping in.
The situation is similar for XRP, where the $0.22250-0.22500 area is the level to watch for potential support bounces.
XRP/BTC pair is lagging a lot
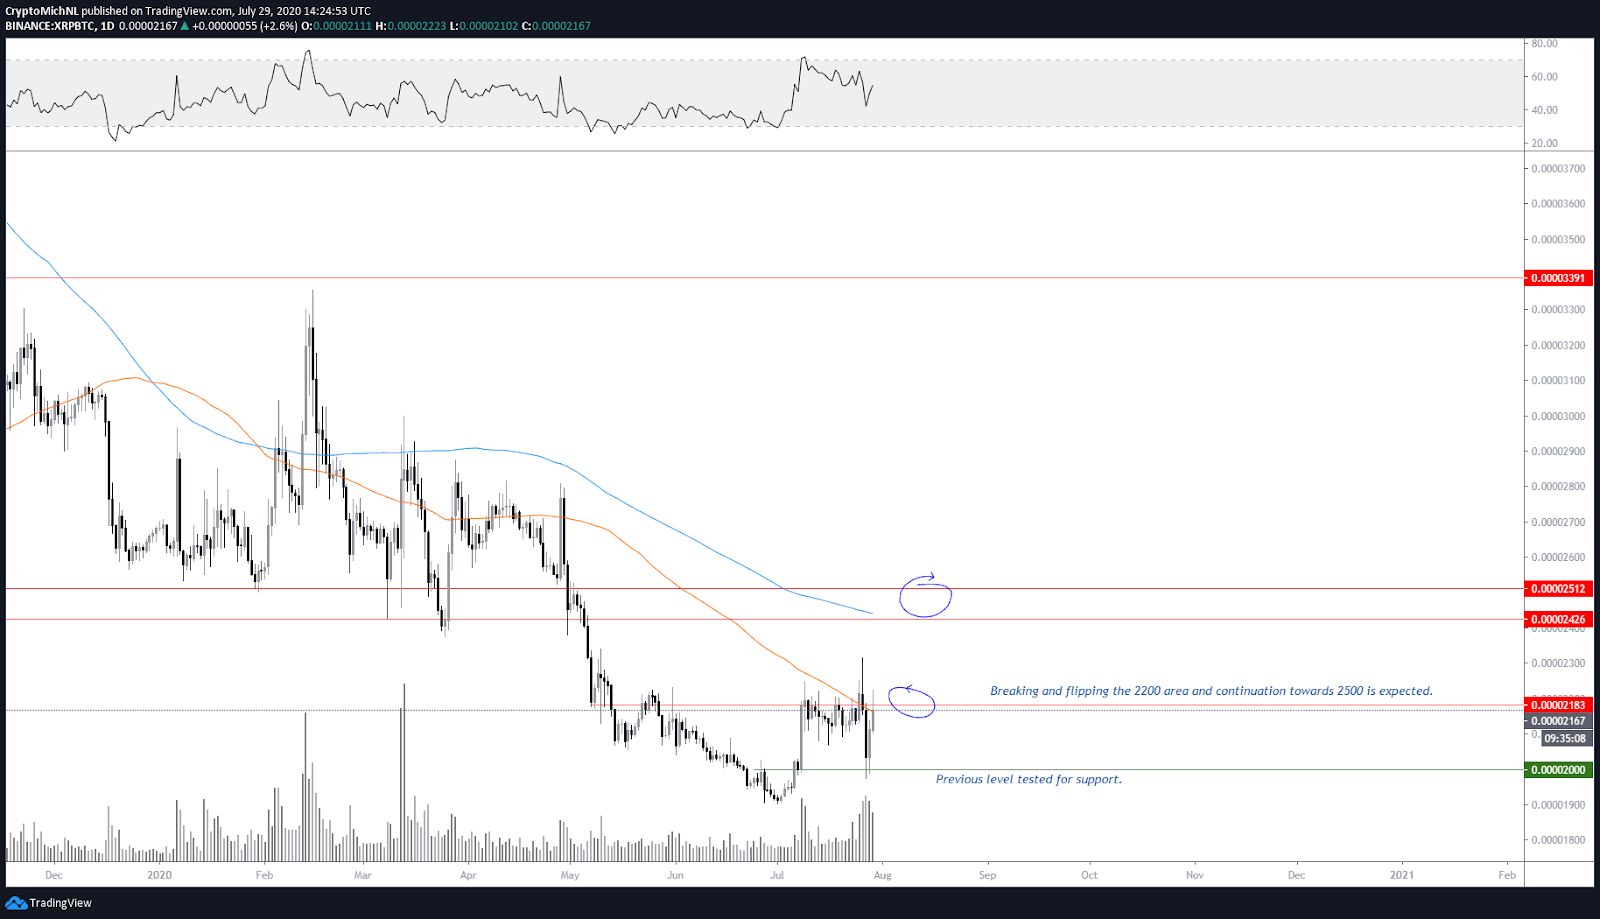
XRP/BTC 1-day chart. Source: TradingView
The BTC pair of XRP has shown massive volatility in the last few days due to the strong surge in Bitcoin price.
However, XRP also bounced back as one of the most reliable coins in the recent move but should more upside be expected for XRP?
The XRP/BTC pair is attacking the 100-day and 200-day MAs and seems to be lagging heavily behind the gains in USDT.
However, once the 0.00002200 sats level breaks and holds as support (the well-known support-resistance flip), a test of the 0.00002450-0.00002525 sats enters the picture. If the 0.00002450-0.00002525 level breaks, the real party starts, as there is open air until 0.00003300-0.00003400 sats.
As known from previous articles, the crucial levels are the 100-day and 200-day MAs that need to flip into support, which will make the XRP/BTC bullish.
Will Stellar Lumens follow XRP in these movements?
As XRP is showing strength, its sister-token Stellar Lumens (XLM) has already seen massive moves in the previous weeks. The price of XLM broke through the heavy resistance zone at $0.08 and is currently consolidating above this level.

XLM/USDT 1-day chart. Source: TradingView
The USDT chart of Stellar Lumens is showing a clear picture of the crucial levels that can be defined as support and resistance.
The $0.08 area acted as resistance for more than a year. The accumulation period started as the price couldn’t break through this zone. This period can be spotted by the volume at the price bottom that increased significantly in recent months.
As the price of Stellar Lumens broke through the $0.08 resistance level, more upside is very likely. However, for such a continuation to occur, the price has to confirm the previous resistance level as support.
This was attempted by the recent correction as some more consolidation seems to be expected. However, as long as Stellar Lumens holds the $0.08 area for support, further continuation toward $0.14 is on the table.
What are the crucial levels to hold for XLM/BTC?

XLM/BTC 1-day chart. Source: TradingView
The BTC pair of Stellar Lumens got destroyed through the volatility of Bitcoin. In consensus, a drop below 0.0000850-0.00000870 sats would be bad for this chart, as the price would be breaking back in the previous range.
However, the more important levels to hold are the 100-day and 200-day MAs. As long as these hold and the price of XLM sustains the 0.00000760 sats price level as support, it’s likely that XLM will continue moving upward in the coming months.
Establishing support at 0.00000760 sats will create a new higher-low. And as Stellar Lumens just made a higher-high at 0.00001100 sats, it’s likely to expect a new test and a probable higher-high to come.
Nothing is for certain, however, as volatility returns to Bitcoin (and altcoins typically don’t do well when this happens.)
But the strength of XRP shows promise for altcoins, which would benefit from Bitcoin price stability and likely result in more upside across the board for many cryptocurrencies.
The views and opinions expressed here are solely those of the author and do not necessarily reflect the views of Cryptox. Every investment and trading move involves risk. You should conduct your own research when making a decision.