

- ETH price is declining and it recently broke the $172 and $170 support levels against the US Dollar.
- The price is trading in a bearish zone and it could slide further towards the $160 support.
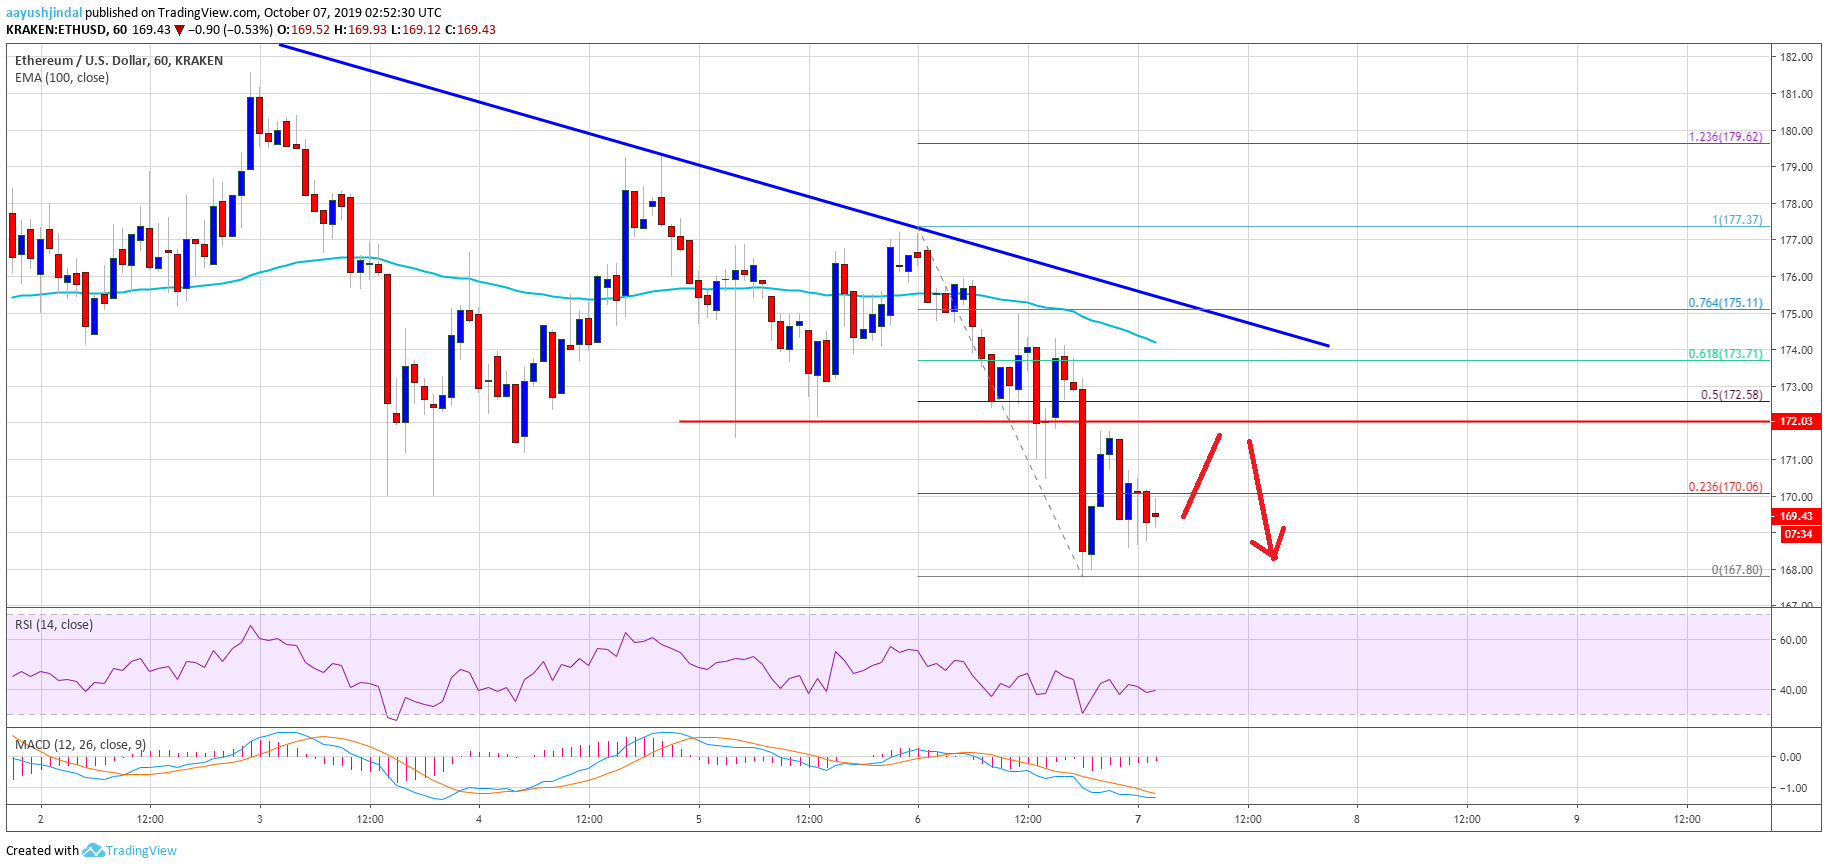
- There is a major bearish trend line forming with resistance near $174 on the hourly chart of ETH/USD (data feed via Kraken).
- The pair might correct a few points higher, but upsides might be capped near $172 and $175.
Ethereum price is showing bearish signs versus the US Dollar, while bitcoin is declining. ETH price might continue to move down and it could test $160.
Ethereum Price Analysis
Recently, Ethereum failed to surpass the $180 resistance area against the US Dollar. As a result, ETH price started a fresh decline below the $175 support area. Moreover, there was a close below the $175 support and the 100 hourly simple moving average. The price even broke the $172 and $170 support levels. A new weekly low was formed near $167 and the price is currently consolidating losses.
An immediate resistance is near the $170 level. It coincides with the 23.6% Fib retracement level of the recent decline from the $177 high to $167 low. The main hurdles for the bulls are near the $172 and $175 levels. Moreover, there is a major bearish trend line forming with resistance near $174 on the hourly chart of ETH/USD. An intermediate resistance is near the 50% Fib retracement level of the recent decline from the $177 high to $167 low.
Therefore, an upside correction from the current levels might face sellers near the $172 and $175 levels. A successful close above the $175 level and the 100 hourly SMA could open the doors for a recovery towards the $180 and $185 resistance levels.
If there is no recovery above $175, the price might continue to move down. An immediate support is near the $165 level. A downside break below the $165 support could set the pace for a drop towards the $160 support area in the near term.
Looking at the chart, Ethereum price is clearly trading in a bearish zone below the $175 level and the 100 hourly SMA. To recover, the price must settle above the $175 pivot level. If not, there is a risk of a downside break below the $165 and $160 support levels. The main support is near the $155 and $154 levels.
ETH Technical Indicators
Hourly MACD – The MACD for ETH/USD is slowly reducing its bearish slope.
Hourly RSI – The RSI for ETH/USD is currently near the 40 level, with no major positive signs.
Major Support Level – $165
Major Resistance Level – $175


