Ethereum traded to a new yearly high at $636 before correcting lower against the US Dollar. ETH price is showing bearish signs and it could decline heavily if there is a break below $570.
- Ethereum started a downside correction after trading to a new yearly high at $636.
- The price is trading below the $600 level and approaching the 100 hourly simple moving average.
- There is a key bearish trend line forming with resistance near $590 on the hourly chart of ETH/USD (data feed via Kraken).
- The pair is likely to continue lower if it fails to stay above $570 and the 100 hourly SMA.
Ethereum Price is Down 4%
There was a decent increase in Ethereum above the $600 and $620 levels. ETH price even broke the previous swing high and traded to a new yearly high at $636. However, the bulls failed to gain strength, resulting in a sharp decline below $620 (similar to bitcoin).
The price broke the $600 support level to move into a short-term bearish zone. The last swing high near $620 before the price declined towards the $575 support. A low is formed near $574 and the price is currently consolidating losses.
It traded above the 23.6% Fib retracement level of the recent decline from the $620 high to $574 low. Ether is currently facing a strong resistance near the $590 and $595 levels.
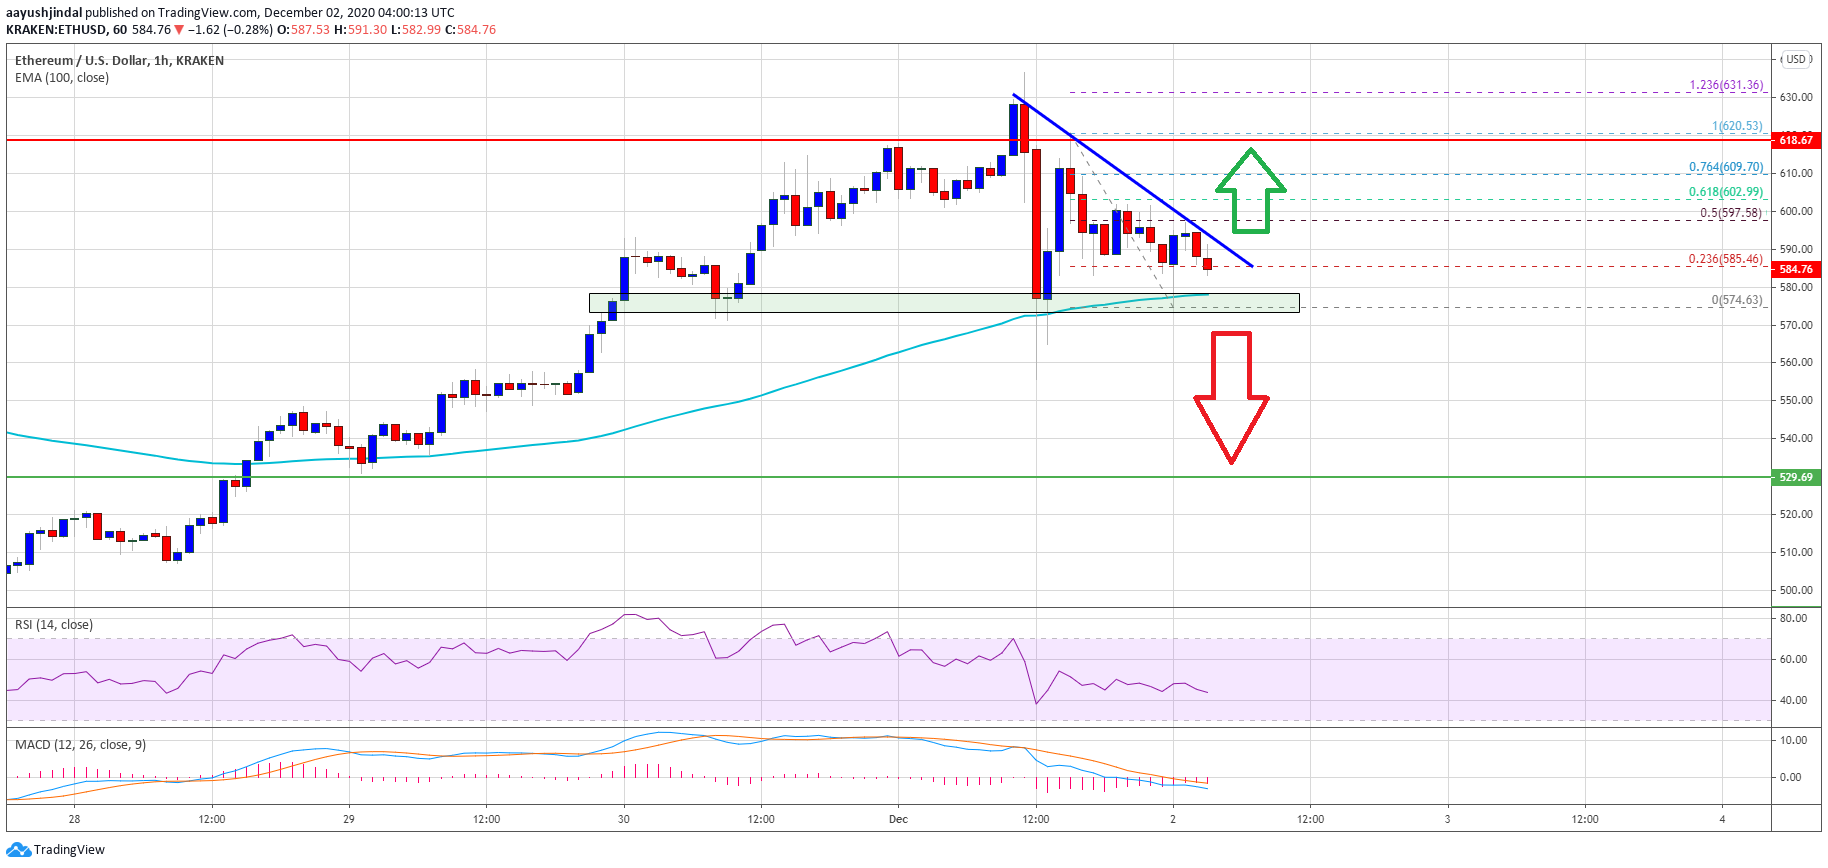
Source: ETHUSD on TradingView.com
There is also a key bearish trend line forming with resistance near $590 on the hourly chart of ETH/USD. The 50% Fib retracement level of the recent decline from the $620 high to $574 low sits at $597. A clear break above the trend line resistance and then $597 could start a decent increase.
The next key resistance is near the $600 level. A successful close above the $600 level could lead the price towards the $620 resistance in the near term.
Downside Break in ETH?
If ethereum fails to clear the trend line resistance and $597, there is a risk of more downsides. An initial support is near the $575 level and the recent swing low.
The main support is forming near the $570 level and the 100 hourly simple moving average. A proper close below the $570 level and the 100 hourly SMA could spark a sharp decline towards the $550 and $530 levels.
Technical Indicators
Hourly MACD – The MACD for ETH/USD is slowly gaining momentum in the bearish zone.
Hourly RSI – The RSI for ETH/USD is currently well below the 50 level.
Major Support Level – $570
Major Resistance Level – $600