
After the bullish price action that transpired on Monday, Bitcoin has been dealt a blow over the past few hours, tumbling from the daily high at $7,470 to a local low of $7,070 — slightly more than a 5% drop from the local high.
This weakness comes as the stock market has stumbled for the first time in a week, with the S&P 500 index actually posting a slight 0.16% loss since the Tuesday open and after Monday’s 7% performance.
But is this it for Bitcoin bulls?
Related Reading: After Trashing Bitcoin, McAfee Is Promoting These Three Altcoins
Bitcoin Bull Case Remains Intact
According to many analysts, Bitcoin’s bull case remains intact, despite the recent weakness.
In a post to his Telegram channel, popular crypto trader Filb Filb noted that BTC’s weakness stopped at two key levels: the 100-week moving average (simple MA) and the yearly volume-weighted average price, which implies that bulls remain in control for the time being. Bitcoin also remains above the yearly open price, adding credence to the bull case.
Furthermore, a number of positive technical trends remain intact.
Bloomberg wrote last week that Bitcoin’s recent move higher has allowed it to trigger a “positive divergence and a buy signal,” according to the indicator the DVAN Buying and Selling Pressure Gauge.
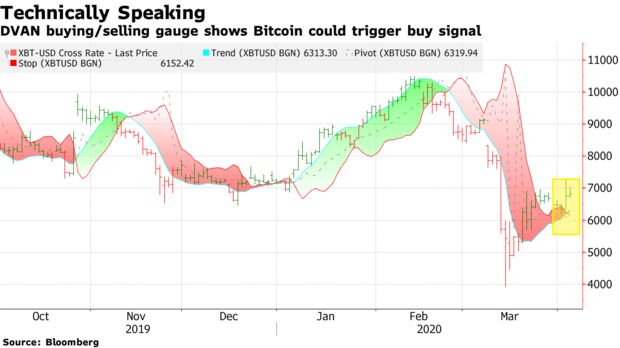
BTC last saw this trend in January, prior to the 50 percent surge from $7,000 to $10,500. The same indicator also flipped bearish when BTC fell under $10,000 in the middle of February, adding credence to the recent signal.
There’s Still Overhead Resistance
Importantly, if Bitcoin manages to follow through and continue higher, there remains some strong resistance above the current price.
Trader Coiner-Yadox remarked that between $7,900 and $8,100 exists a massive confluence of key technical levels, making it clear that this range will be essential for bulls to cross. At that level exists the following:
- The 20-month simple moving average
- the 50-day, 100-day, and 200-day simple moving averages
- the 61.8 percent Fibonacci Retracement of the February top to March bottom.
- a yearly pivot level.
- and more.
Featured Image from Shutterstock