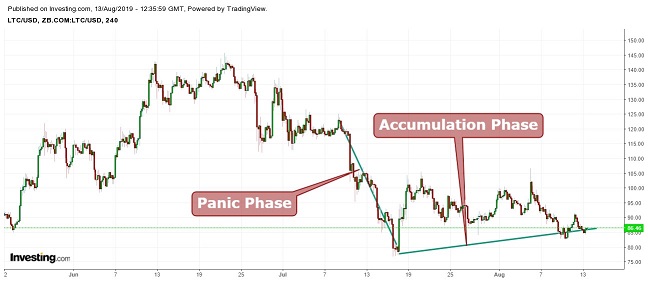
Litecoin (LTC)trade is currently trading at $85.61. In the graph below it can be seen that the digital coin was trading between the channels but recently it has broken the lower limit of the channel, indicating a further correction. The channel’s lower limit is at $87.55, and is acting as resistance with support at $82.80.
Dow Theory
According to Dow Theory, the virtual coin is currently appearing in the accumulation phase after the panic phase. The accumulation phase is a period when long-term investors are actively buying stock against the general opinion of the market.
During this phase, the stock price does not change much because these crypto investors are in the minority, demanding stock that the market at large is supplying. This is usually followed by the participation phase where more active buying starts.
Bollinger Bands
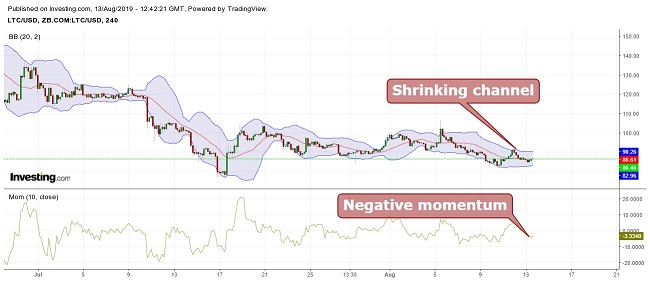
LTC price is moving between the channels, with the upper limit acting as resistance and the middle average line acting as support. The channel is shrinking with negative momentum, indicating lesser volatility with a bearish sentiment. It suggests that the cryptocurrency price might not move much.
Moving Average
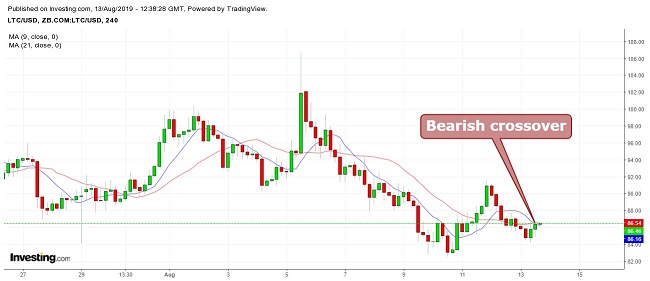
When taking 9 period moving averages (blue) with 21 period moving averages (red), a bullish crossover is seen but Litecoin’s price is trading below both moving averages i.e. 9 and 21. This indicates an indecision in the crypto market.
Therefore taking long positions is not suggested until the virtual currency price closes above the moving average with a bullish crossover.
Conclusion
Litecoin (LTC)trade is currently trading at $85.61. The resistance level is at $87.55 and the support level is at $82.80. It is suggested not to take long positions at this price, as there is an indecision in the market with a negative momentum.
Long positions can be taken once the cryptocurrency price enters the channel, keeping the channel’s lower limit at $86.46 as support and the channel’s upper limit at $87.5 as a target. If the price breaks the support level, the price can fall up to $77. Swing trading can be done using the above-mentioned levels.
Pivot Points
| Name | S3 | S2 | S1 | Pivot Points | R1 | R2 | R3 |
| Classic | 52.355 | 67.439 | 76.454 | 91.538 | 100.553 | 115.637 | 124.652 |
| Fibonacci | 67.439 | 76.645 | 82.332 | 91.538 | 100.744 | 106.431 | 115.637 |
| Camarilla | 78.843 | 81.052 | 83.261 | 91.538 | 87.679 | 89.888 | 92.097 |
| Woodie’s | 49.321 | 65.922 | 73.420 | 90.021 | 97.519 | 114.120 | 121.618 |
Technical Indicators
| Name | Value | Action |
| RSI(14) | 47.951 | Neutral |
| STOCH(9,6) | 23.105 | Sell |
| STOCHRSI(14) | 0.980 | Oversold |
| MACD(12,26) | 7.804 | Buy |
| ADX(14) | 38.501 | Neutral |
| Williams %R | -86.414 | Oversold |
| CCI(14) | -90.2107 | Sell |
| ATR(14) | 22.3813 | High Volatility |
| Highs/Lows(14) | -9.6060 | Sell |
| Ultimate Oscillator | 44.056 | Sell |
| ROC | -2.234 | Sell |
| Bull/Bear Power(13) | -18.9930 | Sell |

If You Liked This Article Click To Share