

The Bitcoin price today chartered into positive territory after weeks of bearish action near $3,400. It rose close to 10% while clearing through a stubborn resistance area of $3,480-3,500.
A sudden spike is as incredible as it is scary. There are questions about its origins. Is it natural for an asset to wake from a bearish slumber and rise 10%? Now if that has happened, how severe would the next bearish correction be? And most importantly, how far BTC can extend its gains as it trends higher in its overbought territory?
A celebrated cryptocurrency analyst attempted to answer with his latest theory.
Adam-and-Eve Meets Bitcoin
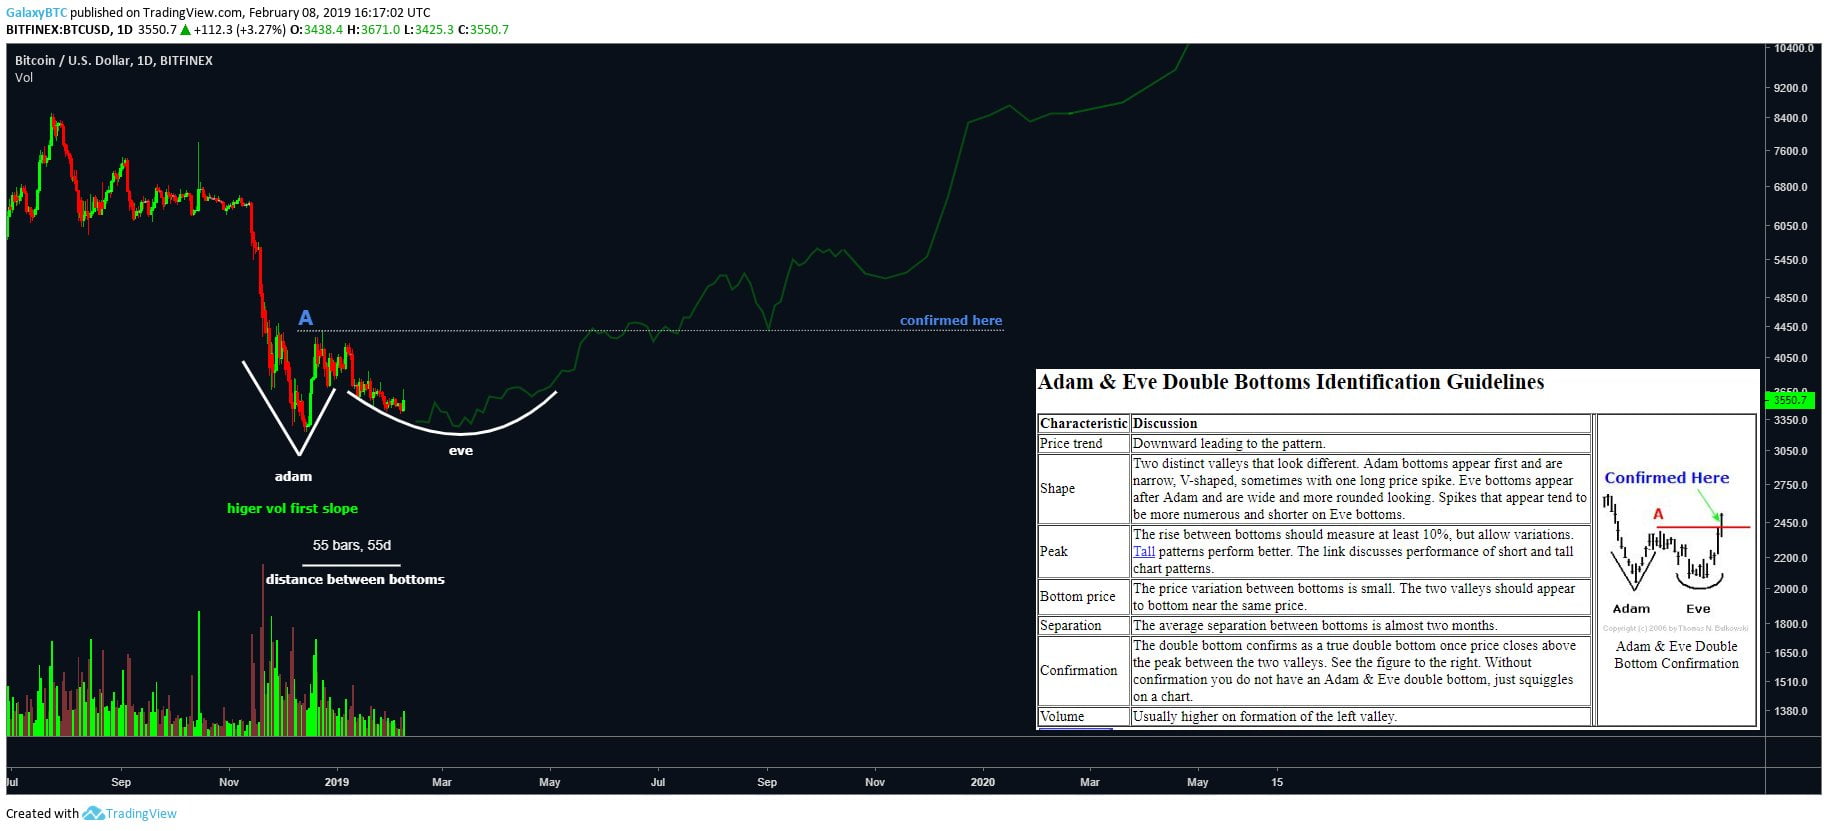
GalaxyBTC, a Twitter-based cryptocurrency analyst with close to 47.8k followers, pitted the current bitcoin price action against a widely-used technical indicator called Adam-and-Eve. The page found that that BTC was following the technical indicator pattern almost too correctly, which means the price could go even higher from where it is right now.
Adam-and-Eve, technically, is a double-bottom scenario, in which the price first forms a narrow, pointed V-shaped bottom called Adam. After that, the price corrects higher, falls again to retest the said Adam’s valley bottom. But this time, the new bottom formation is more rounded and broader, which is called Eve. The chart shared by GalaxyBTC shows that the bitcoin price is forming the same Adam-and-Eve price formation. It would be confirmed once the price closes above the peak between two valleys.
What if. $BTC pic.twitter.com/UT5ay7ElDn
— Galaxy (@galaxybtc) February 8, 2019
Per GalaxyBTC, the Adam valley’s high lies somewhere near $4,390. If BTC confirms a breakout action above the said level, then the price could be aiming at a full-fledged recovery towards – to begin with – $6,000.
Could Bitcoin Reclaim $6,000?
Reclaiming a level that had held bears for far too long in 2018 would signal a robust long-term sentiment for Bitcoin. Adam-and-Even somewhat predicts something that every bitcoin enthusiast wants to be true. However, speaking realistically, the digital currency has enough barries to break before it even thinks about a “full-fledged recovery.”
According to Eric Theis, the current uptrend is a part of “deja-vu” descending channel formations over the recent months. In English, what he means is that bitcoin could fall even lower.
Rinse, Repeat.
Rinse, Repeat.Deja Vu pic.twitter.com/CGaZx9FmrN
— Eric Thies (@KingThies) February 7, 2019
The chart above indicates that bitcoin is inside a falling wedge pattern. It means the asset would undergo a breakout action in the near-term, only to consolidate sideways after that. Then, it would fall again while repeating the earlier price actions.
Meanwhile, the bitcoin market appears more bullish when it comes to fundamentals. Not to mention that the latest rally developed right after Robert J. Jackson Jr., a commissioner at the Securities and Exchange Commission, said that they would approve a bitcoin exchange-traded fund in the future.
According to Gabor Gurbacs, the director of digital assets strategy at VanEck, a regulated Bitcoin ETF would attract at least a billion dollars to the digital currency space. At the same time, the launch of Bakkt, an ICE-backed bitcoin futures platform, could attract more institutional investors to space.
$6,000 looks like an easy target to achieve, therefore.
But then, who knows.

