- Ripple price remained well supported on the downside near the $0.3200 level against the US dollar.
- The price traded higher and broke the $0.3250 and $0.3320 resistance levels.
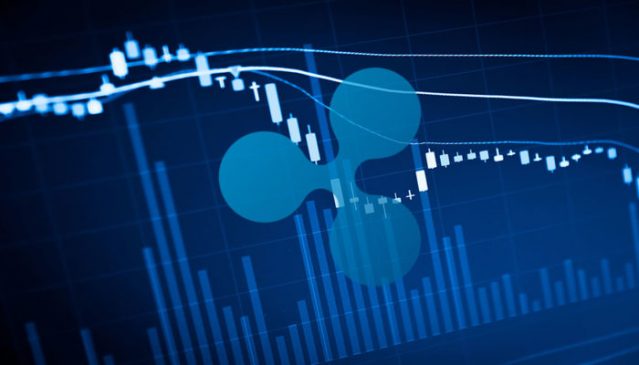
- There is a key bullish trend line forming with support at $0.3265 on the hourly chart of the XRP/USD pair (data source from Kraken).
- The price is likely to continue higher, with chances of an upside break above $0.3350 and $0.3400.
Ripple price is trading with a bullish bias against the US Dollar, similar to bitcoin. XRP price is likely to climb higher towards the $0.3400 and $0.3500 resistance levels.
Ripple Price Analysis
After a successful daily close above $0.3000, ripple price started an upward move against the US Dollar. The XRP/USD pair broke the $0.3080 and $0.3120 resistance levels to move into a positive zone. Moreover, there was a close above the $0.3200 level and the 100 hourly simple moving average. Finally, the price broke the $0.3250 and $0.3320 resistance levels. A new intraday high was formed at $0.3418 and the price recently corrected lower.
It broke the $0.3350 and $0.3320 support levels. Moreover, there was a break below the 50% Fib retracement level of the last wave from the $0.3099 low to $0.3418 high. However, the decline was protected by the $0.3220 support area and the 100 hourly simple moving average. Besides, the 61.8% Fib retracement level of the last wave from the $0.3099 low to $0.3418 high also acted as a support.
More importantly, there is a key bullish trend line forming with support at $0.3265 on the hourly chart of the XRP/USD pair. The pair remains well supported above $0.3250 and the 100 hourly SMA. If there is a downside break below the $0.3250 support and the 100 hourly SMA, the price could accelerate downsides towards the $0.3200 and $0.3150 support levels.
On the upside, an immediate resistance is near the $0.3340 level. If there are more upsides, the price could continue to climb towards the $0.3400 and $0.3500 levels. An intermediate resistance is near the $0.3440 level.
Looking at the chart, ripple price seems to be trading in a positive zone above the $0.3300 and $0.3250 support levels. As long as there is no close below $0.3250 plus the 100 hourly SMA, the price could continue to rise. On the upside, the first target for the bulls could be $0.3400, above which there are chances of a run to $0.3500.
Technical Indicators
Hourly MACD – The MACD for XRP/USD is slowly gaining pace in the bullish zone.
Hourly RSI (Relative Strength Index) – The RSI for XRP/USD is currently placed nicely above the 50 level.
Major Support Levels – $0.3260, $0.3220 and $0.3150.
Major Resistance Levels – $0.3400, $0.3440 and $0.3500.