

- Ripple price is trading in a downtrend below the $0.2750 resistance against the US dollar.
- The price is facing a lot of hurdles on the upside near the $0.2740 and $0.2750 levels.
- This week’s crucial bearish trend line is intact with resistance near $0.2800 on the hourly chart of the XRP/USD pair (data source from Kraken).
- Besides, Ethereum is still holding the key $182 and $180 support levels.
Ripple price is struggling to recover and trading in a bearish zone against the US Dollar and bitcoin. XRP price remains at a risk of more losses below $0.2660.
Ripple Price Analysis
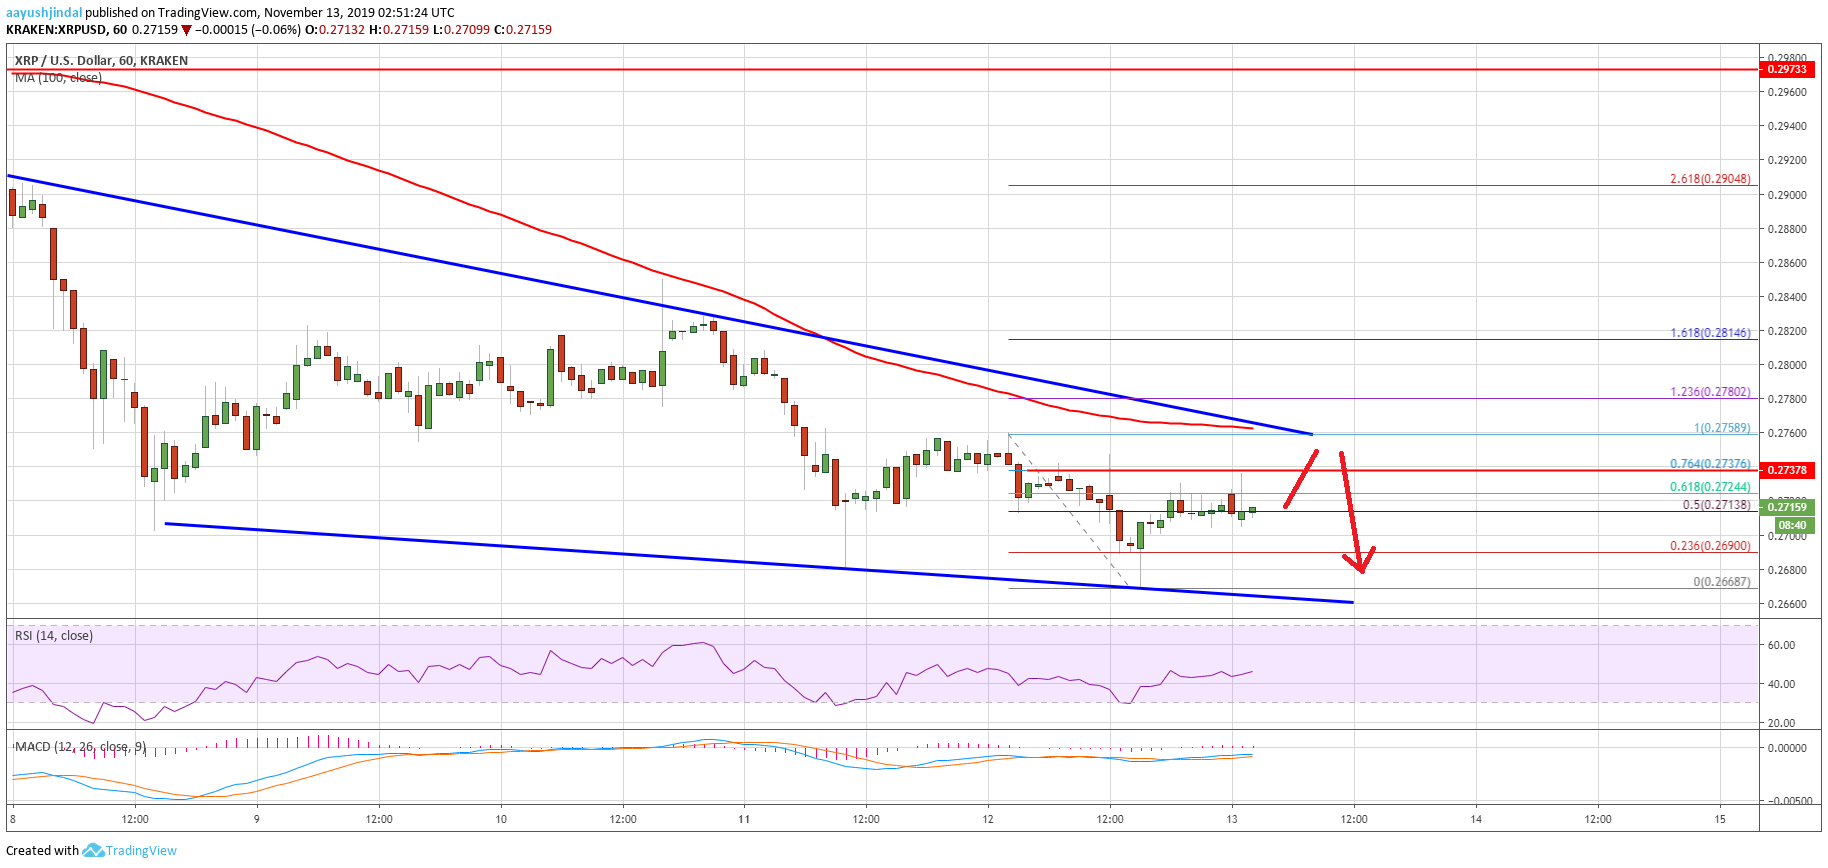
In the past few days, ripple followed a bearish path below the $0.2900 resistance area against the US Dollar. Moreover, XRP/USD settled below the key $0.2800 area and the 100 hourly simple moving average.
It opened the doors for more downsides below the $0.2750 support area. Recently, the price traded below the last swing low near $0.2680 and declined below $0.2670. A new monthly low was formed near $0.2668 and the price is currently correcting higher.
It broke the $0.2700 and $0.2710 resistance levels. Additionally, ripple climbed above the 50% Fib retracement level of the recent drop from the $0.2758 high to $0.2668 low.
However, the price seems to be facing a lot of hurdles on the upside near the $0.2740 and $0.2750 levels. More importantly, this week’s crucial bearish trend line is intact with resistance near $0.2800 on the hourly chart of the XRP/USD pair.
Furthermore, the 61.8% Fib retracement level of the recent drop from the $0.2758 high to $0.2668 low is also acting as a resistance. Therefore, a clear break above the $0.2740 and $0.2750 resistance levels is needed for more gains in the near term.
Once there is a clear break above $0.2750 and the 100 hourly SMA, the price could recover towards the $0.2820 and $0.2850 resistance levels. On the downside, an initial support is near the $0.2660 level. If the bulls fail to defend the $0.2660 and $0.2650 support levels, the next stop for the bears may perhaps be $0.2620.
Looking at the chart, ripple price is clearly struggling below $0.2800 and $0.2750. A downtrend is in place and it seems like there are chances of more losses below the $0.2650 support level. In the mentioned case, the main support where the bulls may take a stand could be $0.2580.
Technical Indicators
Hourly MACD – The MACD for XRP/USD is showing no signs of a decent recovery in the bearish zone.
Hourly RSI (Relative Strength Index) – The RSI for XRP/USD is currently just below the 50 level.
Major Support Levels – $0.2660, $0.2650 and $0.2620.
Major Resistance Levels – $0.2740, $0.2750 and $0.2820.


