

- Ripple price is currently declining from the key $0.2320 resistance area against the US dollar.
- The price is now trading below $0.2260 and it is showing a few bearish signs.
- Yesterday’s major bullish trend line was breached with support near $0.2280 on the hourly chart of the XRP/USD pair (data source from Kraken).
- Ethereum is also struggling and it is declining towards the $144 support area.
Ripple price is under a minor bearish pressure against the US Dollar, similar to bitcoin. XRP price remains at a risk of a drop towards the $0.2140 support area in the near term.
Ripple Price Analysis
In the past few days, there was a decent increase in ripple price above the $0.2200 resistance against the US Dollar. XRP price traded above the $0.2250 and $0.2280 resistance levels.
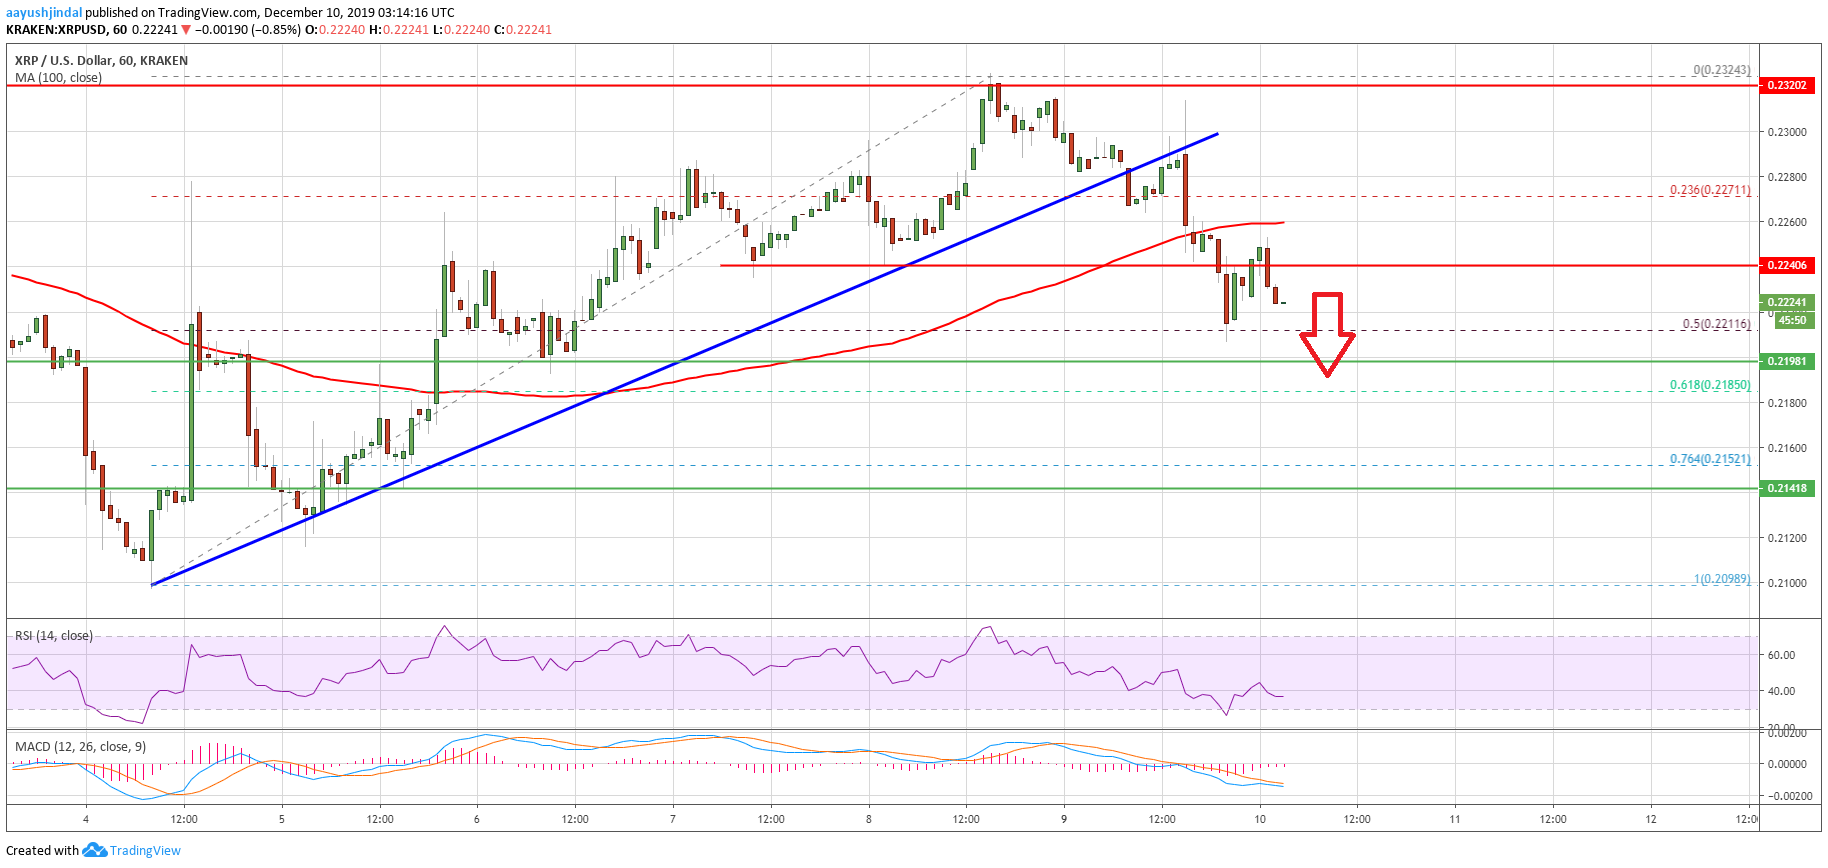
Moreover, there was a clear break above the $0.2300 resistance and the 100 hourly simple moving average. However, the price struggled to gain strength above the key $0.2320 resistance area.
A high was formed near $0.2324 before the price started a fresh decrease below $0.2300. Besides, there was a break below the 23.6% Fib retracement level of the upward move from the $0.2098 low to $0.2324 high.
More importantly, yesterday’s highlighted major bullish trend line was breached with support near $0.2280 on the hourly chart of the XRP/USD pair. Additionally, the pair settled below $0.2260 and the 100 hourly simple moving average.
Ripple is now trading below the $0.2240 and approaching the 50% Fib retracement level of the upward move from the $0.2098 low to $0.2324 high. It seems like the $0.2210 and $0.2200 levels are decent supports.
If the price fails to stay above the $0.2200 support, it could continue to move down towards the $0.2140 level. An intermediate support is near the 61.8% Fib retracement level of the upward move from the $0.2098 low to $0.2324 high.
On the upside, the previous support near $0.2240 may perhaps act as a resistance. The first key resistance could be $0.2260 and the 100 hourly SMA. Therefore, the price must move above $0.2240 and $0.2260 to revisit the key $0.2320 resistance area in the near term.
Looking at the chart, ripple price is showing a few bearish signs below $0.2260, similar to bitcoin and Ethereum. If ETH slides below $144 and bitcoin breaks $7,260, there are chances of a drop in XRP towards $0.2100.
Technical Indicators
Hourly MACD – The MACD for XRP/USD is slowly gaining strength in the bearish zone.
Hourly RSI (Relative Strength Index) – The RSI for XRP/USD is currently correcting high, but it is still below 50.
Major Support Levels – $0.2210, $0.2200 and $0.2140.
Major Resistance Levels – $0.2240, $0.2260 and $0.2320.


