

- Ripple price is declining and trading below the $0.2560 pivot level against the US dollar.
- Bitcoin is down more than 3% today and Ethereum broke a major support near $178.
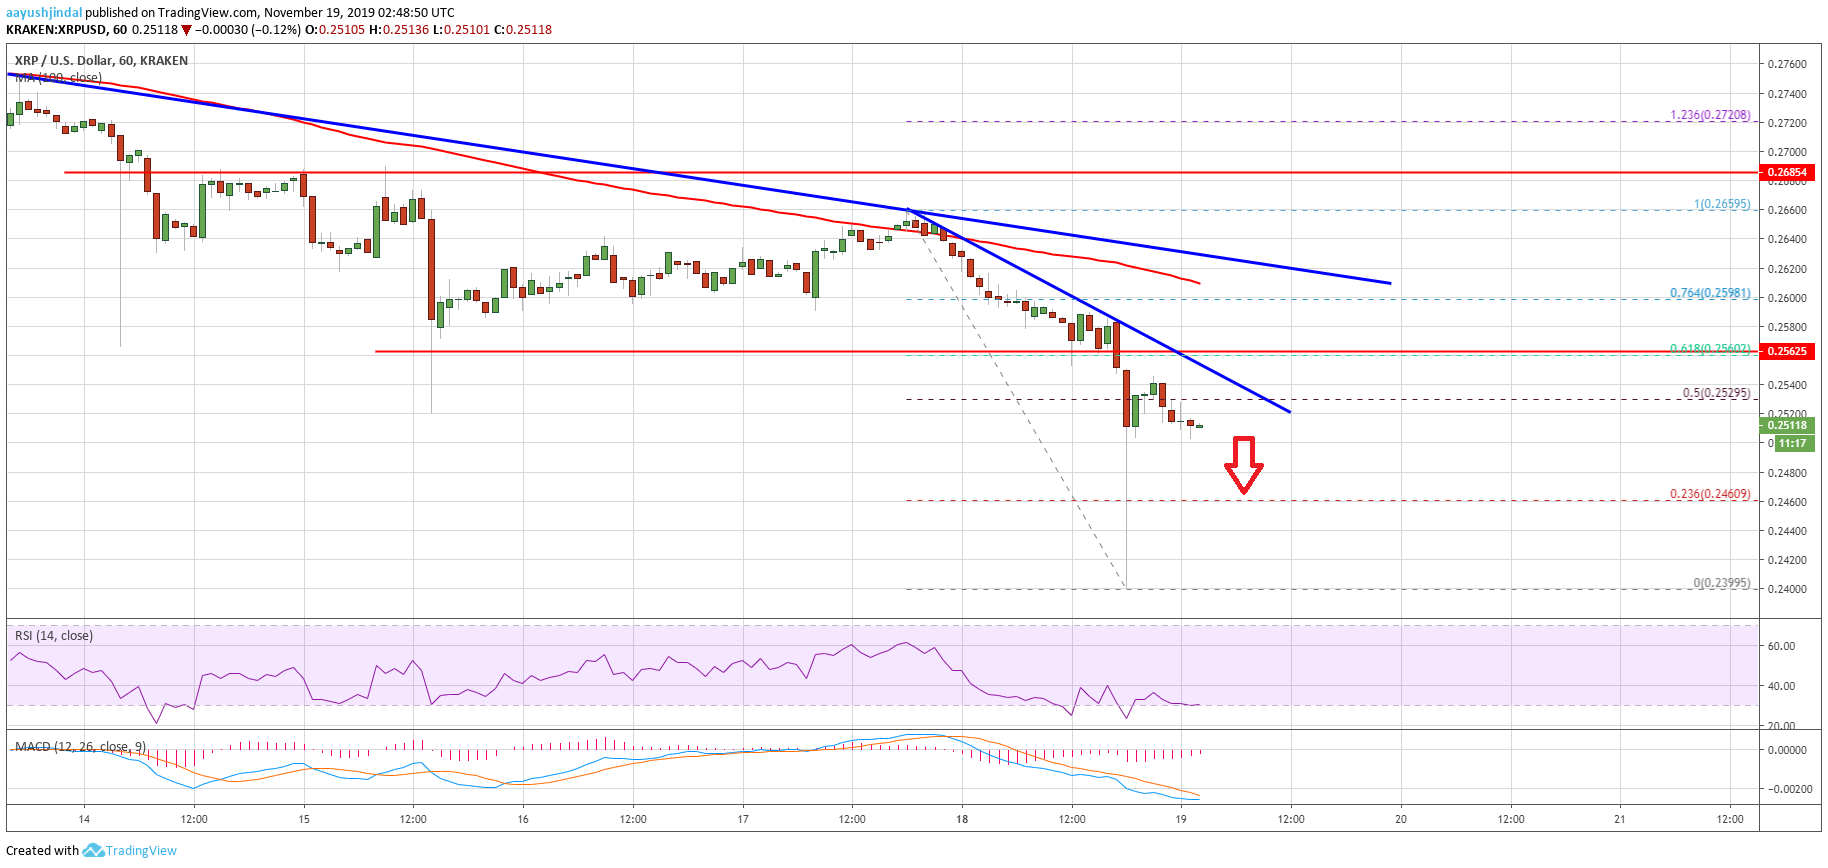
- There is a new connecting bearish trend line forming with resistance near $0.2530 on the hourly chart of the XRP/USD pair (data source from Kraken).
- The price tumbled recently and tested the $0.2400 support area.
Ripple price is trading in a crucial downtrend against the US Dollar, while bitcoin is approaching $8K. XRP price is likely to struggle near the $0.2560 and $0.2600 resistances.
Ripple Price Analysis
After forming an intermediate top near the $0.2660 level, ripple declined heavily against the US Dollar. XRP/USD broke many key supports near $0.2560 to move further into a bearish zone.
Moreover, there was a close below the $0.2560 level and the 100 hourly simple moving average. It opened the doors for more losses and the price declined heavily below the $0.2500 level.
The recent decline gained pace below the $0.2450 level and ripple tested the $0.2400 support area (as discussed in yesterday’s analysis). A new monthly low was formed near $0.2399 and the price is currently correcting higher.
It is testing the 50% Fib retracement level of the recent decline from the $0.2659 high to $0.2399 low. On the upside, there are many resistances near the $0.2540 and $0.2560 levels.
Besides, there is a new connecting bearish trend line forming with resistance near $0.2530 on the hourly chart of the XRP/USD pair. Above the trend line, ripple price is likely to struggle near the $0.2580 level and the 100 hourly simple moving average.
More importantly, the 76.4% Fib retracement level of the recent decline from the $0.2659 high to $0.2399 low is likely to act as a strong resistance. Finally, yesterday’s highlighted bearish trend line is intact with resistance near $0.2620 on the same chart.
On the downside, an immediate support is near the $0.2480 level. If the price starts a fresh decline below $0.2480, it is likely to test the $0.2420 and $0.2400 levels. Any further downsides depend whether bitcoin breaks the $8,000 support and continue lower.
Looking at the chart, ripple price is clearly gaining bearish momentum below $0.2560. In the short term, there could be an upside correction, but the overall trend remains bearish as long as the price is trading below the $0.2700 level.
Technical Indicators
Hourly MACD – The MACD for XRP/USD is slowly reducing its bearish slope.
Hourly RSI (Relative Strength Index) – The RSI for XRP/USD is now well below the 40 level, with a bearish angle.
Major Support Levels – $0.2480, $0.2420 and $0.2400.
Major Resistance Levels – $0.2560, $0.2580 and $0.2620.

