

Ripple failed to continue higher above $0.2150 and declined sharply against the US Dollar. XRP is showing bearish signs just like bitcoin and it could dive further below $0.2000.
- Ripple traded as high as $0.2146 and recently started a sharp decline against the US dollar.
- The price is now trading well below $0.2050 and remains at a risk of more losses.
- There was a break below a key bullish trend line with support near $0.2060 on the hourly chart of the XRP/USD pair (data source from Kraken).
- The pair is likely to continue lower if it breaks the $0.2000 and $0.1950 support levels.
Ripple Price Turns Red
After a steady rise, ripple price faced a strong selling interest near the $0.2150 resistance. The key driving force was bitcoin, declining more than 6% below the $10,000 and $9,500 levels.
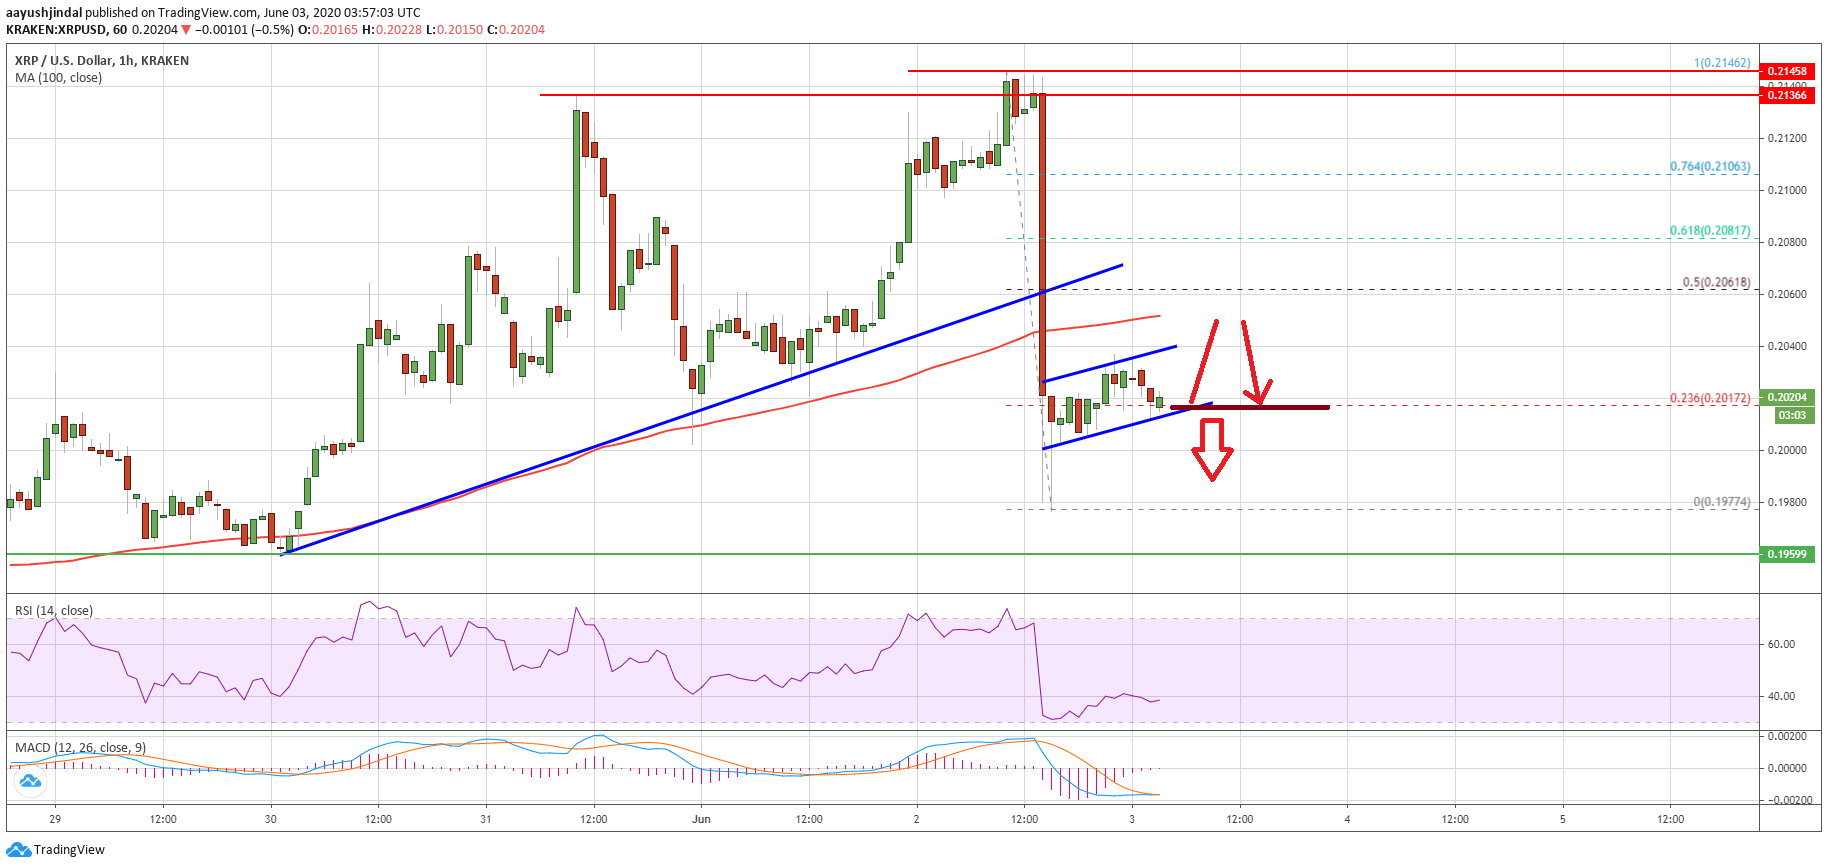
XRP price followed a bearish path from the $0.2146 high and it declined sharply below $0.2100. There was a break below the $0.2050 support and the 100 hourly simple moving average.
Moreover, there was a break below a key bullish trend line with support near $0.2060 on the hourly chart of the XRP/USD pair. The pair traded as low as $0.1977 and it is currently correcting higher. It recovered above the $0.2000 level.
Ripple managed to climb above the 23.6% Fib retracement level of the recent decline from the $0.2146 high to $0.1977 low. However, the price struggled to continue above $0.2050. It is currently following a short term ascending channel with support near $0.2010.
If the price fails to stay above the $0.2000 support zone, it is likely to resume its decline. The first major support is near the $0.1950 level, below which it could revisit the main $0.1920 support. Any further losses may perhaps start a significant decline towards the $0.1800 level in the near term.
Recovery in XRP?
On the upside, an initial resistance is near the $0.2050 level and the 100 hourly simple moving average. The next major resistance is near the $0.2060 level or the 50% Fib retracement level of the recent decline from the $0.2146 high to $0.1977 low.
To start a fresh increase, the price must surpass the $0.2060 and $0.2065 resistance levels. Any further gains could lead the price towards the $0.2100 zone in the coming sessions.
Technical Indicators
Hourly MACD – The MACD for XRP/USD is slowly moving into the bullish zone.
Hourly RSI (Relative Strength Index) – The RSI for XRP/USD is currently well below the 40 level.
Major Support Levels – $0.2000, $0.1950 and $0.1920.
Major Resistance Levels – $0.2050, $0.2060 and $0.2100.
Take advantage of the trading opportunities with Plus500
Risk disclaimer: 76.4% of retail CFD accounts lose money.

