

- Ripple price is currently correcting higher from the $0.1741 low against the US dollar.
- It seems like the bulls are struggling to clear the $0.2000 resistance area.
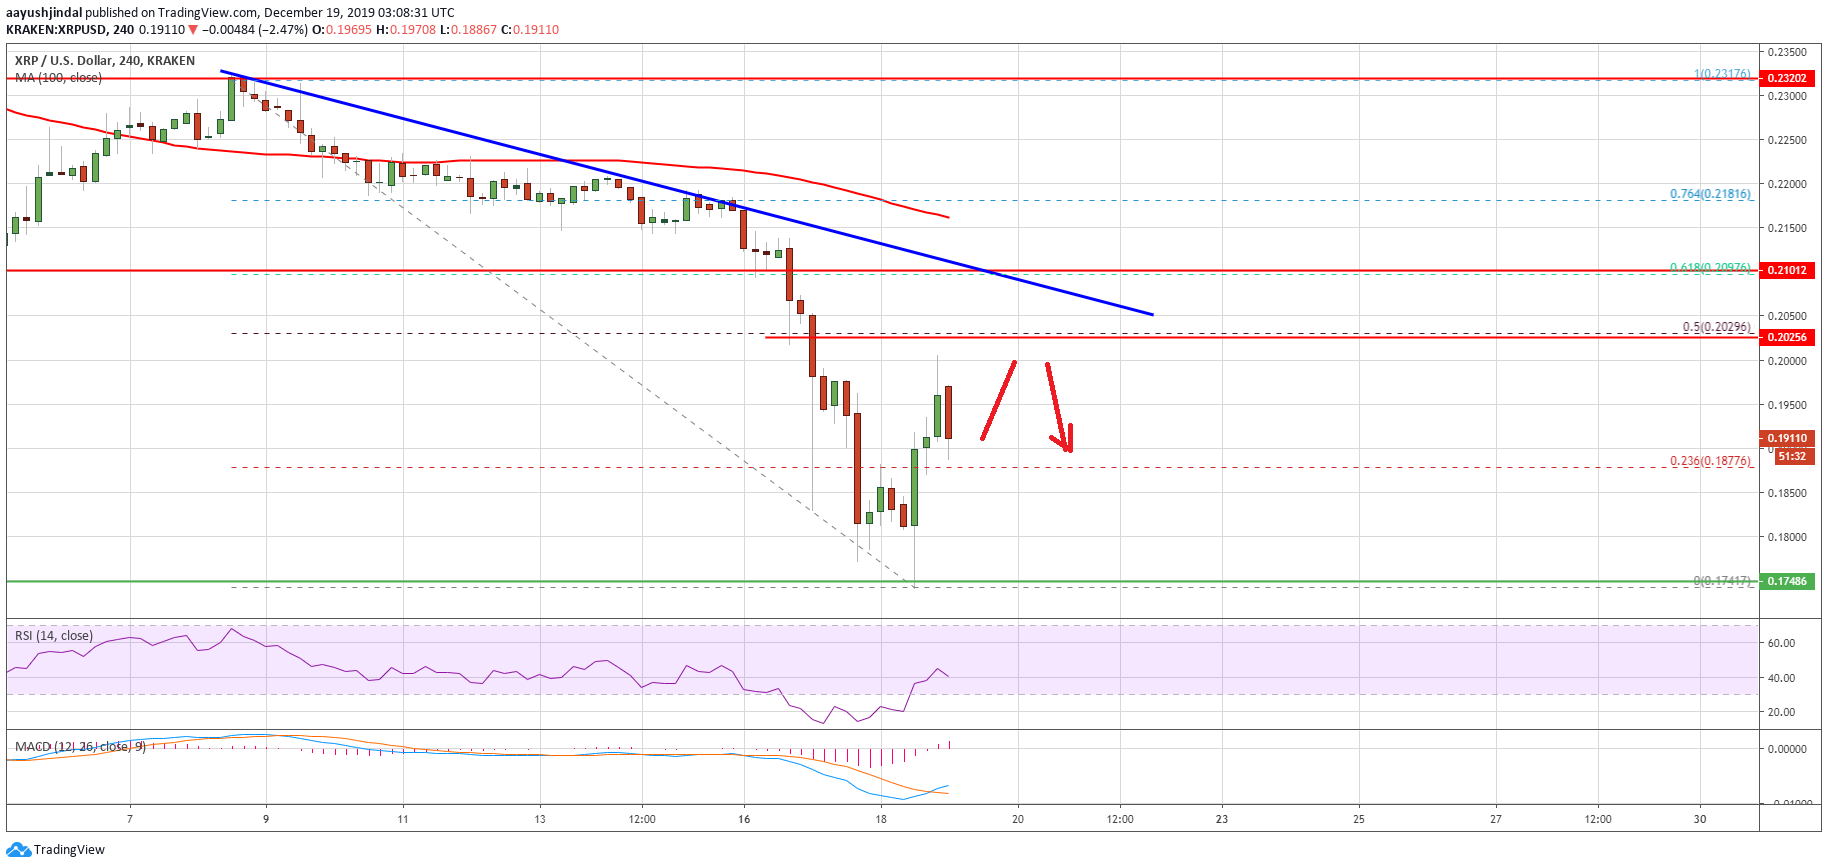
- Yesterday’s highlighted major bearish trend line is active with resistance near $0.2050 on the hourly chart of the XRP/USD pair (data source from Kraken).
- Bitcoin rallied more than 10% and Ethereum is showing reversal signs above $125.
Ripple price is struggling to gain bullish momentum against the US Dollar, while BTC and ETH are reversing. XRP price might continue to struggle near $0.2000 and $0.2050.
Ripple Price Analysis
The past few hours were significant, as the crypto market saw a reversal in bitcoin above $7,000. It helped Ethereum as well above $125, but ripple price struggled to gain strength against the US Dollar. XRP price traded to a new 2-year low at $0.1741, settled well below the 100 hourly simple moving average, and it is currently correcting higher.
Moreover, there was a break above the 23.6% Fib retracement level of the downward move from the $0.2317 high to $0.1741 low. However, there are many hurdles on the upside near $0.2000 and $0.2050.
The price is clearly struggling to gain strength above $0.2000. Besides, yesterday’s highlighted major bearish trend line is active with resistance near $0.2050 on the hourly chart of the XRP/USD pair.
More importantly, the 50% Fib retracement level of the downward move from the $0.2317 high to $0.1741 low is also near the $0.2030 level. Therefore, the price must surpass the $0.2000 and $0.2050 resistance levels to start a strong upward move.
The next key resistance is near the $0.2100 level or the 61.8% Fib retracement level of the downward move from the $0.2317 high to $0.1741 low. A successful daily close above $0.2100 might call for a reversal in ripple.
Conversely, the price could start a fresh decline below the $0.1900 and $0.1880 levels. The main support area is near the $0.1800 level. If there is a daily close below the $0.1800 support area, the price could decline heavily towards $0.1720 or $0.1650.
Looking at the chart, ripple price is slowly correcting higher, but it is clearly facing a strong selling interest near the $0.2000 and $0.2050 levels. Having said that, if bitcoin and Ethereum continues to rise, there are high chances of a sharp upward move in ripple above $0.2000.
Technical Indicators
Hourly MACD – The MACD for XRP/USD is currently moving back into the bullish zone.
Hourly RSI (Relative Strength Index) – The RSI for XRP/USD is still well below the 50 level.
Major Support Levels – $0.1880, $0.1850 and $0.1800.
Major Resistance Levels – $0.2000, $0.2050 and $0.2100.