

Ripple is down close to 5% and it broke the key $0.1810 support zone against the US Dollar. XRP price is currently recovering, but the same support is likely to protect gains.
- Ripple price is back in a bearish zone below the $0.1810 support against the US dollar.
- A new weekly low is formed near $0.1738 and the price is currently correcting higher.
- There is a key bearish trend line forming with resistance near $0.1815 on the hourly chart of the XRP/USD pair (data source from Kraken).
- The pair could correct further, but it is likely to face hurdles near $0.1810 and $0.1820.
Ripple Price Support Turned Resistance
Yesterday, we discussed the importance of the $0.1800-$0.1810 support area for ripple. XRP price failed to continue higher above the $0.1900 resistance and recently declined sharply below the $0.1800-$0.1810 support.
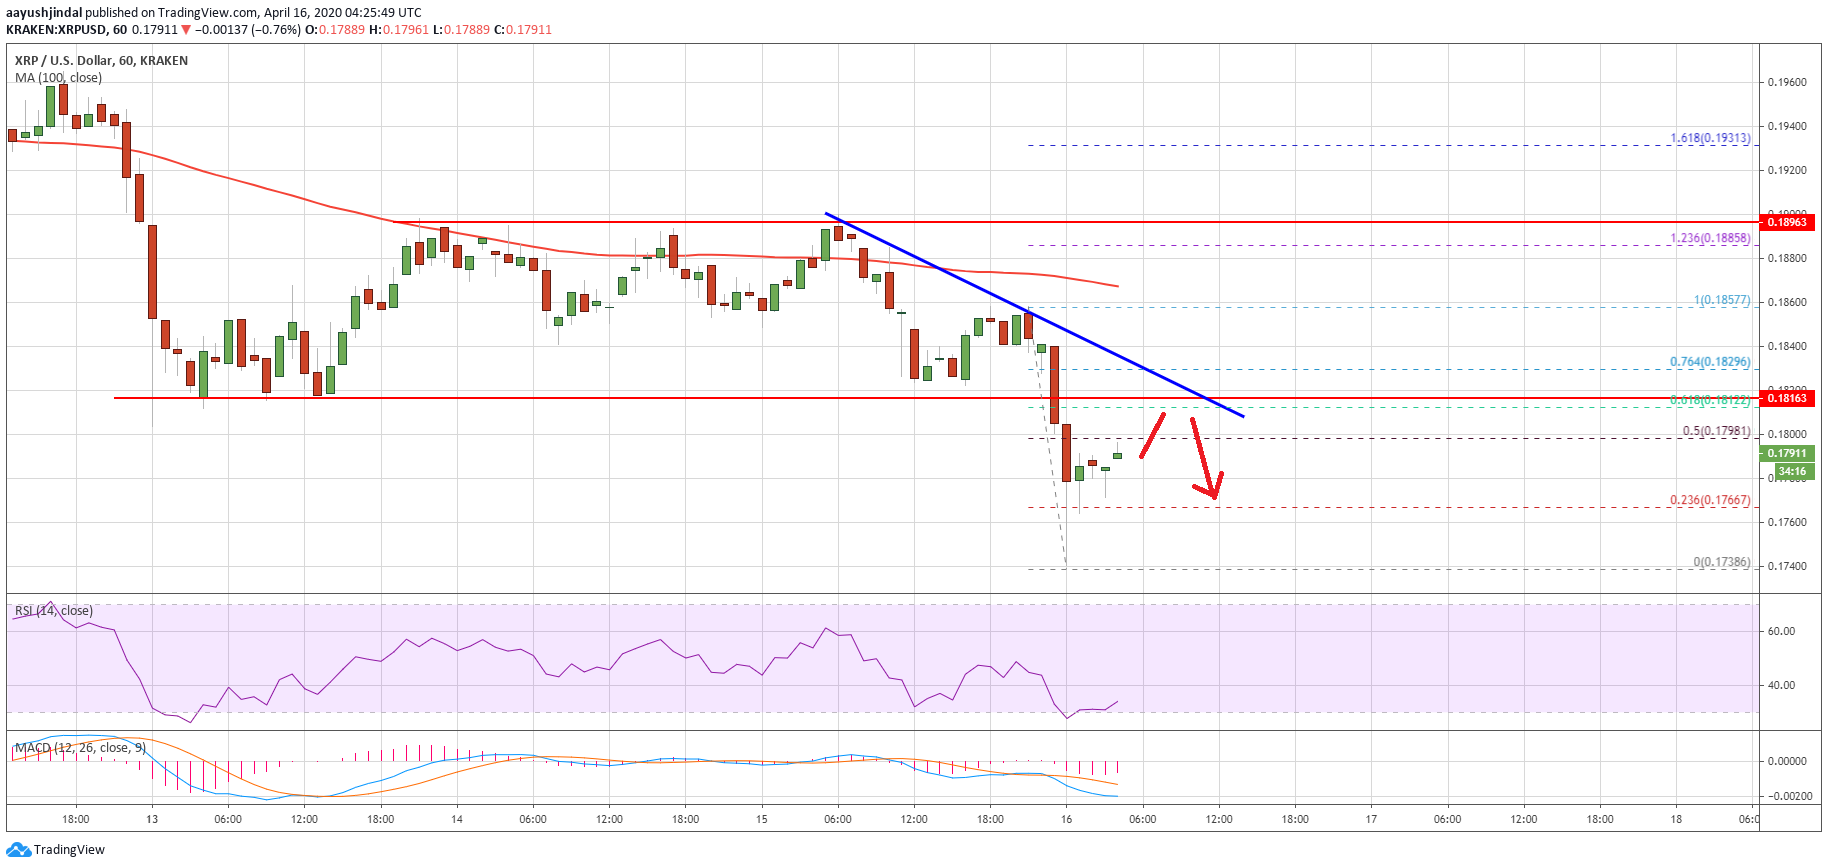
The bears took control, resulting in a close below $0.1800 and the 100 hourly simple moving average. The price traded below the $0.1750 level and formed a new weekly low at $0.1738.
Ripple is currently correcting higher and trading above the $0.1750 level. It is testing the 50% Fib retracement level of the recent drop from the $0.1857 high to $0.1738 low. It seems like the $0.1800 area is currently acting as a hurdle for the bulls.
The main resistance is near the $0.1810 and $0.1820 levels (the recent breakdown zone). The 61.8% Fib retracement level of the recent drop from the $0.1857 high to $0.1738 low is also near $0.1810.
More importantly, there is a key bearish trend line forming with resistance near $0.1815 on the hourly chart of the XRP/USD pair. If the pair corrects further higher, it is likely to face a strong resistance near the $0.1810 and $0.1820 levels in the near term.
A successful close above the $0.1810 and $0.1820 levels might open the doors for a fresh increase towards the $0.1900 and $0.1920 resistance levels.
More Downsides?
If ripple struggles to recover above the $0.1810 and $0.1820 resistance levels, it is likely to resume its decline. An initial support is near the $0.1740 level.
A clear break below the $0.1740 support level might open the doors for more downsides towards the $0.1700 and $0.1680 levels in the near term.
Technical Indicators
Hourly MACD – The MACD for XRP/USD is likely to move into the bullish zone.
Hourly RSI (Relative Strength Index) – The RSI for XRP/USD is now correcting higher towards the 40 level.
Major Support Levels – $0.1740, $0.1700 and $0.1680.
Major Resistance Levels – $0.1800, $0.1810 and $0.1820.
Take advantage of the trading opportunities with Plus500
Risk disclaimer: 76.4% of retail CFD accounts lose money.


