Bitcoin has been rocketing over the last several weeks, along with the rest of the cryptocurrency market. Most assets are up over 80% on average since the start of 2020.
However, an unorthodox and unusual financial forecasting tool could indicate that a major trend change is playing out across markets, with the turning point taking place over the next 24 hours.
Tools of The Trader: How Crypto Analysts And Investors Predict Price Movements
Analysts, investors, and traders rely on several important tools in an attempt to predict or forecast future market movements.
Fundamental analysis considers things like company revenue, or in Bitcoin, the underlying network health, and its digital scarcity. Technical analysis relies on scouring over price charts searching for patterns or signals using indicators and oscillators.
Other tools involve watching sentiment for extreme greed – a point the market has reached recently which may be a tell about where things turn next.
Going further down the rabbit hole of financial asset analysis, there are other, even more unusual methods for predicting future price action, including math, the moon, and the stars.
Related Reading | Crypto Is Up Over 80% in 2020—and Google Users Are Taking Notice
The practice of using astrology for financial forecasting is nothing new. Some of the first recorded trades taken using nothing but astrological-based timing earned William Delbert Gann legendary status.
A number of Gann technical tools exist on platforms like TradingView and other chart analysis software, that rely on geometry and time. Gann also used certain key dates to time tops and bottoms. He often advocated December as a time when assets bottomed and topped – the month exactly that Bitcoin both topped and bottomed in 2017 and 2018.
Gann also warned of a larger financial cycle every 90 some odd years, the last of which was 1929 and the Great Depression. Here we are, some 90 years later, and a pandemic caused a major meltdown on Black Thursday this past March.
Does The Bradley Siderograph Suggest A New Low In Bitcoin, Or Is All-Time High Next?
The drop on that fateful day may have been predicted by a different astrological forecasting method, created by financial analyst Donald Bradley. Bradley has developed an unusual tool called the Bradley Siderograph, which is used to predict major trend changes in financial markets, called “Turn Dates.”
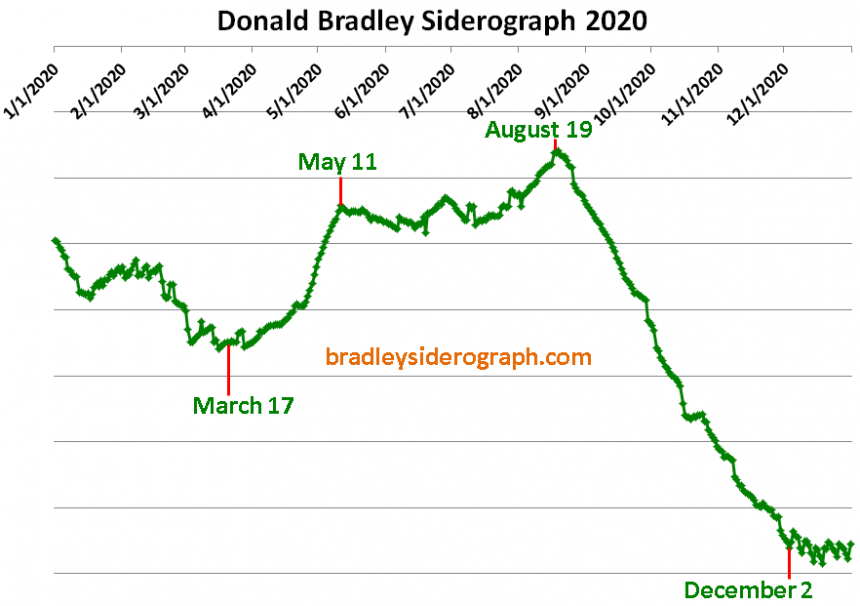
According to the Bradley Siderograph, these Turn Dates can have an enormous impact on financial markets. The first major turn date of the year was on March 17.
Related Reading | Economist: Early Days of Bitcoin Uptrend Are Here, Breakout Has A Long Way To Go
The Siderograph website claims that these dates “typically indicate market turning points within 4-7 calendar days rather than being exact to the day of the turning point.”
Black Thursday was exactly five days ahead of the first major Turn Date of the year.
The next major turn date following Black Thursday was Bitcoin’s halving to the date. The asset has been on an uptrend since, rising 40% from that date alone.
After the halving, the next Turn Date arrives tomorrow, August 19. There isn’t another, all the way until December 2 before the end of the year. Remember, Bitcoin tops or bottoms in December, but it isn’t clear from the Siderograph which direction the trend will turn.
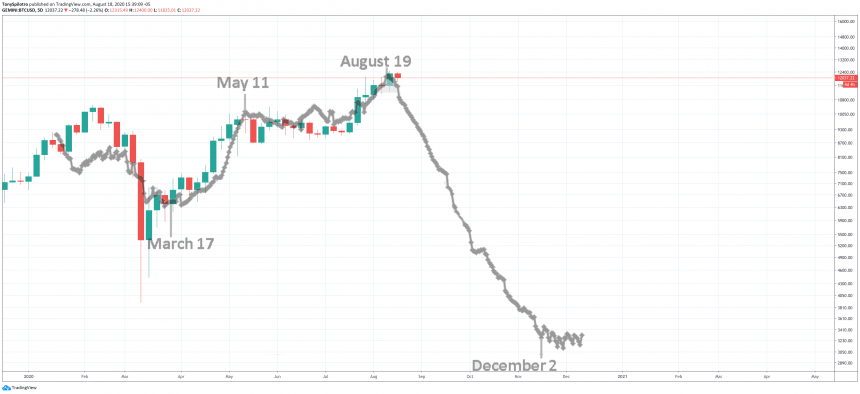
BTCUSD Siderograph Comparison | Source: TradingView
Taking the Sideograph indicator and superimposing it over Bitcoin price action gives a ghastly look at what looks like an enormous drop to new lows in 2020 – lower than Black Thursday’s collapse to $4,000.
However, Turn Dates simply provide guidelines when major trend changes occur, not which direction they head in. And even though the Siderograph trends downward, and as depicted above, has followed Bitcoin price action perfectly so far this year, doesn’t mean a new low is next.
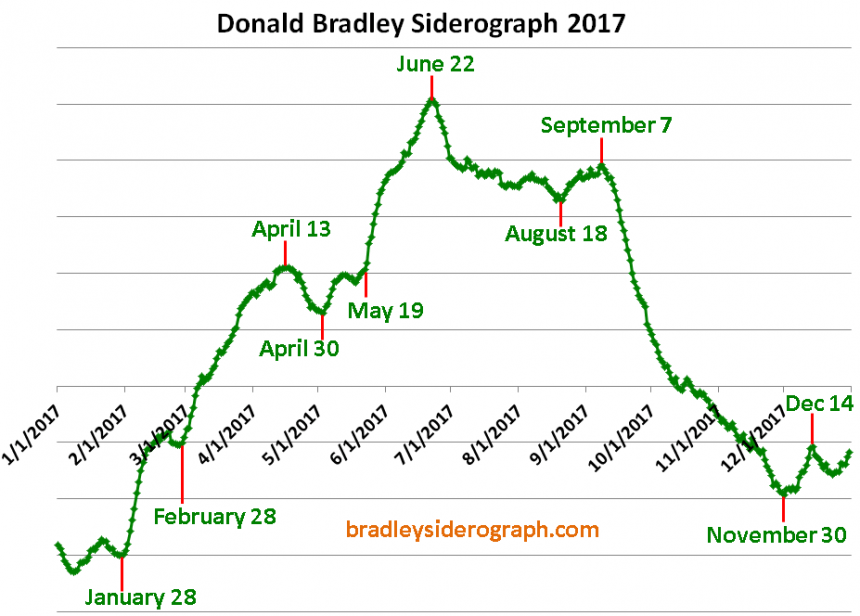
The same Siderograph referenced here from 2017, showed a similar low on December 14. If you recall, Bitcoin price touched $20,000 just three days from that date. This timing is well within the “4-7 days” quoted by the tool.
With August 19 here tomorrow, what will happen at this next Turn Date, or has it already taken place?