View
- Bitcoin’s short-term outlook will remain bearish as long as prices remain below $11,080 resistance. A break above that level would invalidate bearish lower-highs setup.
- The bulls may have a tough time forcing a break above $11,080 amid news of BitMEX exchange facing a regulatory probe and talks of harsher crypto regulation.
- Prices could drop below $10,000 in the next 24 hours with daily chart indicators continuing to report bearish bias.
- A weekly close (Sunday, UTC) above $12,000 is needed to revive the bullish view.
Bitcoin (BTC) has rallied sharply in the last 24 hours, but the outlook remains bearish with prices holding below key resistance around $11,080.
The premier cryptocurrency jumped from $9,200 to $10,400 in just 40 minutes during the U.S. session yesterday, contradicting the case for a drop below $9,097 put forward by multiple rejections at $10,000 in the Asian trading hours.
Price rose further to $10,800 at 23:45 UTC, but closed at $10,648, leaving the crucial resistances of $10,759 (monthly opening price) and $10,850 (daily chart resistance) intact, as tweeted by popular analyst Josh Rager.
Rager wants to see BTC climb $10,850 before calling bullish revival. While that argument has merit, a much stronger confirmation of the bullish breakout would be a high volume move above $11,080.
That would invalidate the bearish lower highs pattern created during the sell-off from $13,200 to $9,049, as seen in the chart below.
Bearish lower highs

As of writing, BTC is changing hands at $10,330 on Bitstamp, having clocked highs above $10,770 at 08:00 UTC.
The cryptocurrency has come under pressure in the last hour or so amid news that the U.S. Commodity Futures Trading Commission (CFTC) is probing BitMEX, which offers trading of cryptocurrencies with up to 100-times leverage and products such as futures and swaps, over whether it allowed Americans to use its platform.
The latest CFTC probe could heighten regulation fears that have gripped markets over the last few days, making it difficult for BTC bulls to force a break above $11,070.
Technical charts are also calling a break below $10,000.
4-hour and daily charts
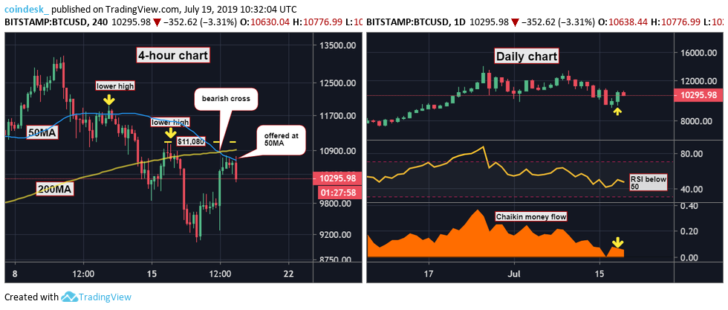
BTC is feeling the pull of gravity, having faced multiple rejections at the 50-candle MA on the 4-hour chart (above left) in the last 18 hours.
With bitcoin’s fall back to $10,300, the bearish crossover of the 50- and 200-candle MAs has gained credence.
Further, the relative strength index (RSI) on the daily chart continues to report bearish conditions with a below-50 print.
The Chaikin money flow index, which takes into account both prices and trading volumes, fell to 0.07 yesterday from 0.08 even though prices rose above $10,000. That divergence (marked by arrow) indicates the buying pressure weakened with the price rise and puts a question mark on the sustainability of gains seen in the last 24 hours.
3-day chart

The 5- and 10-candle MAs have produced a bearish crossover and prices faced rejection at the descending 5-candle MA earlier today.
Further, the moving average convergence divergence (MACD) has turned bearish for the first time since December 2018, as discussed earlier this week.
All-in-all, BTC risks falling below $10,000 in the next 24 hours. On the downside, strong support is located at $9,097 (May 30 high). A violation there would expose the 100-day MA lined up near $8,100.
On the higher side, a high=volume break above $11,080 would invalidate the bearish setup. That said, a weekly close (Sunday, UTC) above $12,000 is needed to confirm bull revival.
This is due to the fact that BTC failed to close above that psychological level for three weeks in a row – a sign of buyer exhaustion noted earlier this week.
Disclosure: The author holds no cryptocurrency assets at the time of writing.
Bitcoin image via Shutterstock; charts by Trading View