Ripple failed to stay above the $0.2500 pivot level and started a fresh decline against the US Dollar. XRP price is likely to continue lower towards $0.2380 or $0.2350.
- Ripple started a fresh decline after it struggled to clear the $0.2590-$0.2600 zone against the US dollar.
- The price is now trading below the $0.2500 support and the 100 hourly simple moving average.
- There was a break below a major contracting triangle with support at $0.2465 on the hourly chart of the XRP/USD pair (data source from Kraken).
- The pair is likely to continue lower towards the $0.2380 support or even $0.2350.
Ripple Price is Showing Bearish Signs
After a strong upward move, ripple failed to stay above the $0.2550 resistance. XRP price topped near the $0.2590-$0.2600 resistance zone, and recently started a steady decline.
A high was formed near $0.2592 before the bears took control. There was a break below the $0.2550 and $0.2500 support levels. The price even spiked below $0.2420 and the 100 hourly simple moving average.
A low was formed near $0.2407 before there was a short-term upside correction. However, the price failed to gain strength above $0.2500 and resumed its decline. There was a break below a major contracting triangle with support at $0.2465 on the hourly chart of the XRP/USD pair.
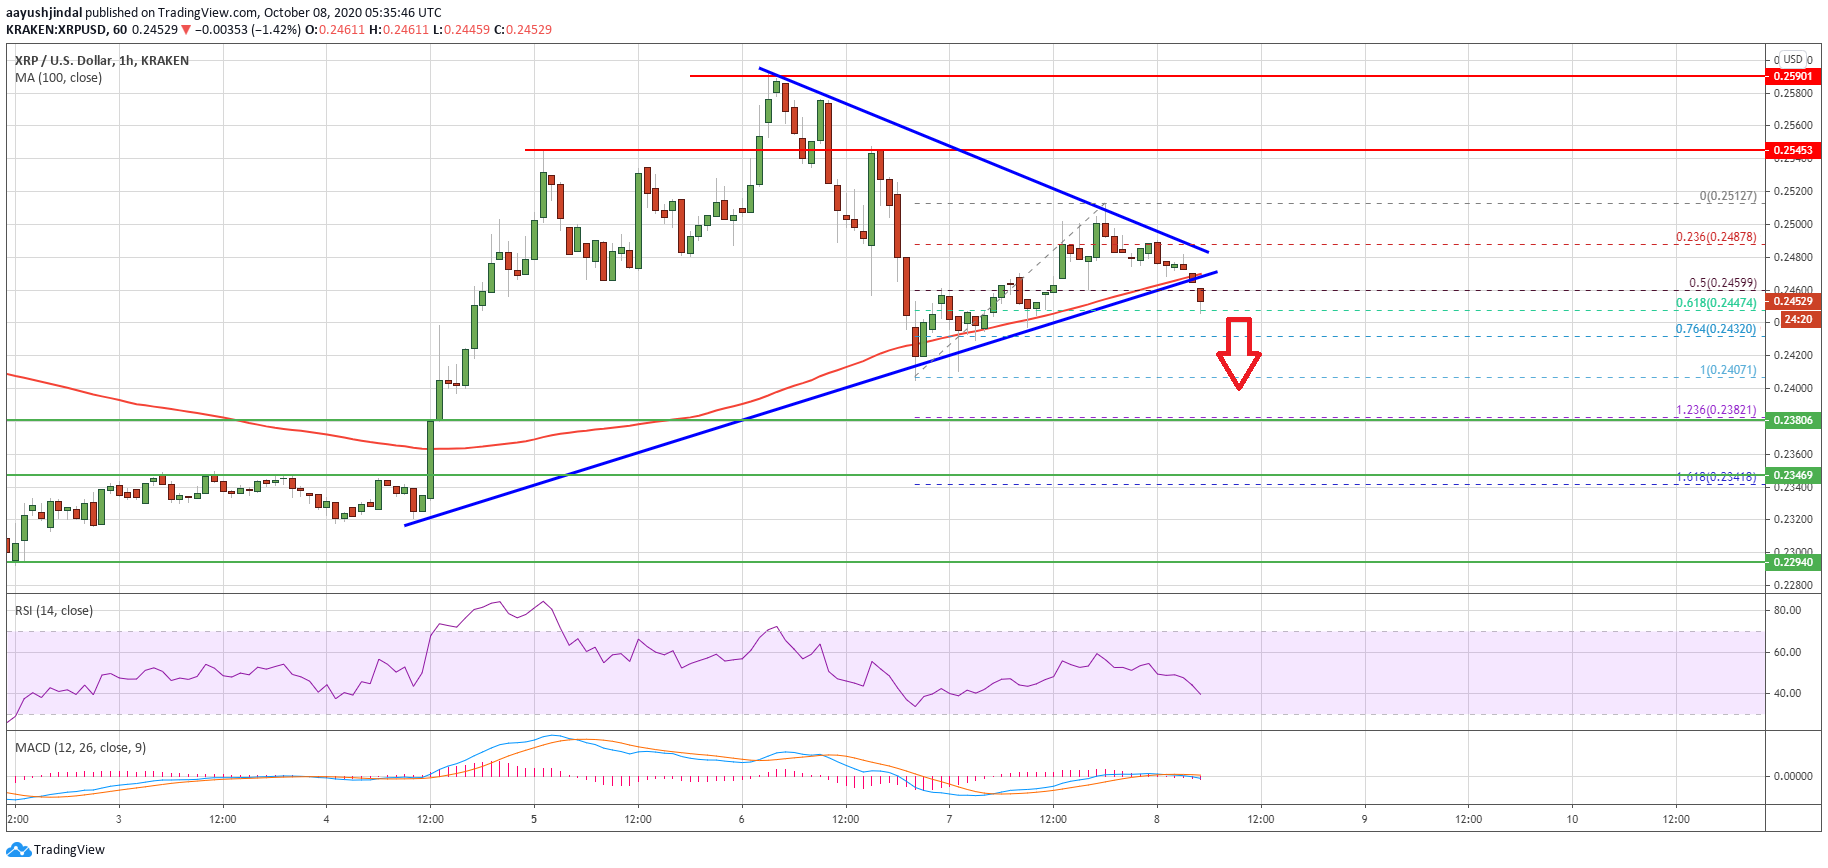
Ripple price dives above $0.2500. Source: TradingView.com
The price is now testing the 61.8% Fib retracement level of the recent upside correction from the $0.2407 low to $0.2512 high. It seems like the bears are aiming more downsides below the $0.2420 support.
The next key support is near the $0.2380 level. It is close to the 1.236 Fib extension level of the recent upside correction from the $0.2407 low to $0.2512 high. Any further losses could lead ripple towards the $0.2350 support.
Fresh Increase in XRP?
An initial resistance for ripple is near the $0.2645 level and the 100 hourly simple moving average. The first major resistance is near the $0.2500 level.
A successful break above the 100 hourly SMA and then a follow up move above the $0.2500 resistance might open the doors for a fresh increase in the near term. The next major resistance is near the $0.2550 level.
Technical Indicators
Hourly MACD – The MACD for XRP/USD is slowly gaining pace in the bearish zone.
Hourly RSI (Relative Strength Index) – The RSI for XRP/USD is currently declining towards the 35 level.
Major Support Levels – $0.2420, $0.2380 and $0.2350.
Major Resistance Levels – $0.2465, $0.2500 and $0.2550.