

Bitcoin failed to recover above the $9,500 resistance and declined sharply against the US Dollar. BTC price is now trading below key supports, suggesting more downsides towards $8,200 or $8,000.
- Bitcoin is down more than 4% and it is now trading well below the $9,000 level.
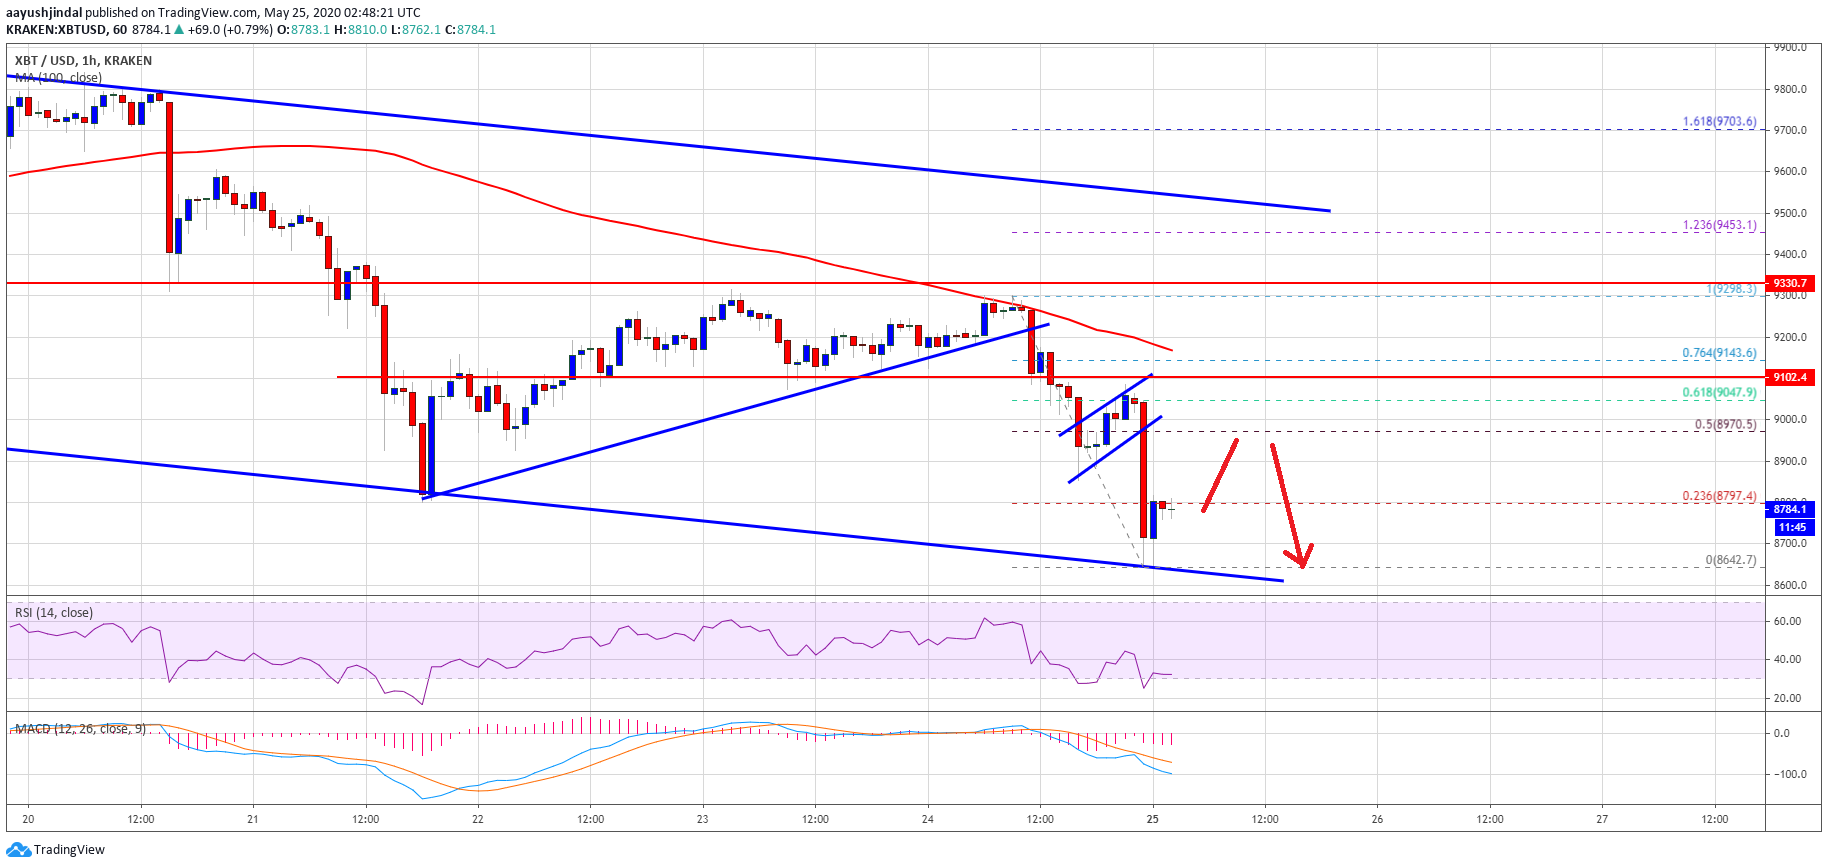
- The price traded as low as $8,642 and it is currently well below the 100 hourly simple moving average.
- There was a break below a key bullish trend line with support at $9,200 on the hourly chart of the BTC/USD pair (data feed from Kraken).
- The pair is likely to continue lower towards $8,200 and $8,000 in the coming days.
Bitcoin Dives 4%
Bitcoin price failed to recover above $9,400 and $9,500 against the US Dollar. As a result, BTC price started a nasty decline and broke many key supports near $9,200 and $9,000 (as discussed in the weekly analysis).
The recent decline was initiated after there was a break below a key bullish trend line with support at $9,200 on the hourly chart of the BTC/USD pair. The pair even broke the last swing low near the $8,800 support.
A new weekly low is formed near $8,642 and the price is currently correcting higher. An initial resistance is near the $8,800 level. It is close to the 23.6% Fib retracement level of the recent decline from the $9,298 high to $8,642 low.
The first major resistance is near the $9,000 level (the recent breakdown zone). It is also near the 50% Fib retracement level of the recent decline from the $9,298 high to $8,642 low.
The main resistance is near the $9,150 level and the 100 hourly simple moving average. To move into a positive zone, the price must recover above the $9,000 level and gain bullish momentum above the $9,150 pivot level.
More Downsides in BTC?
The current price action suggests that bitcoin price might struggle to continue higher above $9,150. On the downside, the main support is near the $8,600 level, which is close to the declining channel lower trend line as discussed in yesterday’s weekly forecast.
If there is a break below the $8,642 low and the $8,600 support, there are chances of more losses. The next key supports are near $8,380, $8,200 and finally $8,000.
Technical indicators:
Hourly MACD – The MACD is currently showing a lot of bearish signs.
Hourly RSI (Relative Strength Index) – The RSI for BTC/USD is now well below the 40 level.
Major Support Levels – $8,600 followed by $8,380.
Major Resistance Levels – $9,000, $9,150 and $9,200.


