The moment all crypto investors have been waiting for may finally be upon us: Bitcoin is about to enter a new bull market.
And while market participants have been saying it for some time now, this indicator first developed in the 1930s and still popular today points to Bitcoin’s new uptrend only just noq beginning, despite an already over 40% return year-to-date.
90-Year-Old Technical Analysis Indicator Signals Buy on Weekly Timeframes
Using technical analysis to chart across multiple timeframes is common practice for all types of traders, crypto, Bitcoin, or otherwise.
Lower timeframes are often paid the closest attention, as these dictate intraday price movements that the cryptocurrency community prefers to speculate over and makes for quick scalp trades.
Related Reading | This Insanely Bizarre Signal Called Bitcoin’s Top Three Times In A Row
But it’s the highest timeframes – daily, weekly, and monthly – that typically dictate the underlying strength of an asset and any trend direction.
A 90-year-old, Japanese technical analysis indicator is signaling that Bitcoin’s new uptrend is just getting started, according to an impending cross of the two Senkou spans.
In the chart below, the Senkou span A (in blue) and the Senkou span B (in red) lines on the Ichimoku indicator, are making a cross that signals an uptrend is starting.
The last time this happened was in May of 2019 while Bitcoin was trading below $6,000. After the cross occurred, the leading cryptocurrency by market cap exploded upward by over another 130%.
Another 130% surge from current levels, would put Bitcoin at a new all-time high near $23,000.
In addition, price has broken into the Kumo on the indicator. Any break above it will further confirm a new uptrend.
Backing Up the Ichimoku Indicator Claims Of A New Bitcoin Bull Market
The Ichimoku Kinko Hyo is a technical analysis indicator designed in the 1930s by journalist Goichi Hosoda.
The journalist’s nickname was Ichimoku Sanjin, which translates to “what a man in the mountain sees.” This man in the mountain aptly named certain aspects of the indicator after what someone in his position would see, such as the Kumo, or cloud.
Related Reading | Ancient Math May Be the Key to Making Crypto Bull Market Riches
The indicator was created to provide a graphic environment that offers analysts an “at a glance” look at all aspects of a market, including support, resistance, momentum, time, and more.
While there are a number of ways to use the indicator, the most common way is watching for a cross of the two Senkou span lines. Others include a twist in the cloud and more.
The indicator is widely used today, despite almost being nearly 100 years old.
Those that aren’t comfortable with such a tool, may feel more comfortable with more common technical analysis practices confirming a new uptrend in Bitcoin.
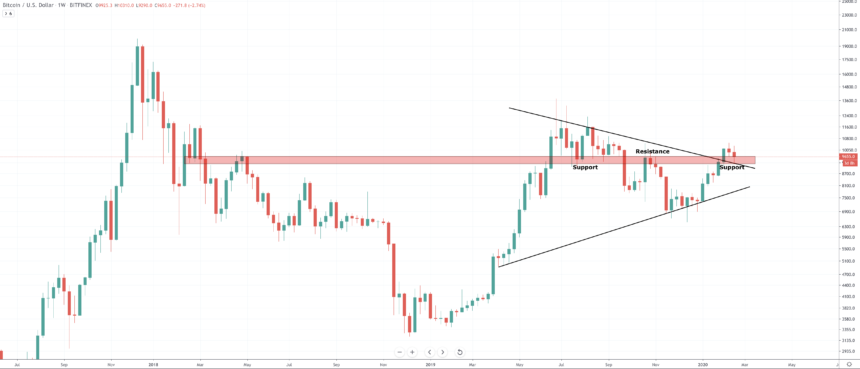
Even just drawing trend lines on weekly timeframes confirms that a breakout has occurred and that the strongest level of resistance has been flipped back into support. This also suggests that the latest pullback across the crypto space is may simply be a retest and confirmation of this resistance turned support.
If that happens, Bitcoin and the rest of the crypto market will enter an uptrend like the Ichimoku indicator suggests, and will likely bring about a new all-time high in the months ahead.