That bitcoin (BTC) has likely found a bottom around $6,000 is now generally accepted, so the challenge for investors and traders is to spot the early signs of a long-awaited bullish reversal.
Basic technical theory suggests that a bearish-to-bullish trend change is confirmed after the price invalidates a “lower highs” pattern – a series of descending peaks. As such, bitcoin needs to rise above the September high of $7,400 to confirm a major bullish breakout.
That would mean the number one cryptocurrency by market cap needs to rally close to 16 percent from the current price of $6,400 before the bulls can claim victory over the bears.
Seasoned traders, however, are always on the lookout for patterns that might allow them to front-run an impending textbook bullish reversal.
In bitcoin’s case, the 3-day chart – on which each candlestick represents price action over a 72-hour period – is signaling that the prospects of bullish reversal would rise sharply if prices can clear the former support-turned-resistance of the 50-candle simple moving average (SMA).
As of writing, BTC is trading at $6,420 on Coinbase, representing a 0.5 percent drop in a 24-hour basis.
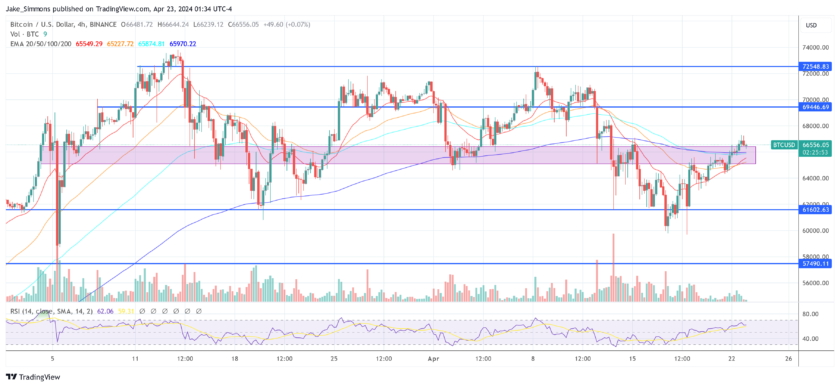
3-day chart
The 50-candle SMA marked on the chart served as a strong support, or buying level, during the entire rally from October 2015 to December 2017.
The SMA support became resistance in February after prices had dropped, and stayed in that role over the months since.
Notably, the recent lower price high of $7,400 was created at the SMA hurdle, so a break above that resistance could be considered an early sign of bullish reversal.
It’s worth noting that BTC’s bullish break above the 50-candle SMA in July ended up trapping the bulls on the wrong side of the market.
Even so, the failed breakout was likely a result of the investor disappointment following the US Securities and Exchange Commission’s rejection of bitcoin exchange-traded funds (ETF) at the time.
Looking ahead, BTC is unlikely to trap the bulls this time round, as the majority of bad news has been priced in.
View
- The outlook as per the 3-day chart remains bearish as long as prices are trading below the 50-candle SMA of $6,642.
- A break above $6,642 would mark the beginning of the long-awaited bullish reversal.
- A move above $7,400 (September high) would signal a completion of the bullish breakout.
Disclosure: The author holds no cryptocurrency assets at the time of writing.
Bitcoin image via Shutterstock; charts by Trading View
Join 10,000+ traders who come to us to be their eyes on the charts and sign up for Markets Daily, sent Monday-Friday. By signing up, you agree to our terms & conditions and privacy policy
The leader in blockchain news, CoinDesk is a media outlet that strives for the highest journalistic standards and abides by a strict set of editorial policies. CoinDesk is an independent operating subsidiary of Digital Currency Group, which invests in cryptocurrencies and blockchain startups.