Bitcoin has been on a stellar run over the past week, gaining 20%, according to data from Coin360.com. It’s a move that has brought the cryptocurrency above resistance level after resistance level, suggesting an uptrend is forming.
Since peaking at $9,500 though, the cryptocurrency has slipped, with BTC now trading at $8,800 as of the time of this article’s writing. It’s a retracement that isn’t all too convincing of the bull case, an analyst has suggested.
Related Reading: Crypto Tidbits: Bitcoin Hits $9ks, a16z Raises $500M Crypto Fund, Ethereum 2.0 Nears
Bitcoin Needs to Retake $9,090 On a Weekly Basis
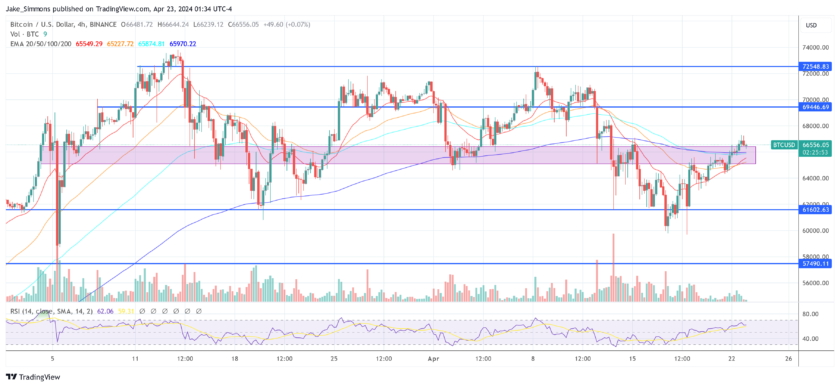
According to a crypto swing trader, Bitcoin closing above $9,090 on a weekly basis will have him “full[y bullish] until further notice,” referencing how the level has been a key resistance and support level over the past year.
Chart from @cryptomeowmoew (Twitter)
BTC closing above $9,090, the chart suggests, would confirm a resistance-support flip of that level, giving the cryptocurrency the fuel to rally even higher.
Unfortunately, it seems that this bullish close will not come to pass, with BTC trading at $8,800 as of the time of this article’s writing.
Unless the cryptocurrency can mount a multi-percent rally in the coming two hours, a weekly close above $9,090 will need to wait until next week.
There Are Other Reasons to Be Bullish
Bitcoin seems unlikely to close the weekly above the level specified by the trader, but analysts say there is a confluence of other reasons to be bullish on the main cryptocurrency on a medium-term time frame.
One well-known trader remarked that there is a strong confluence of reasons to be bullish on Bitcoin at the moment. The confluence of reasons is as follows:
- The funding rate on BitMEX, which is the amount longs pay short, and the premium index, the difference people pay for Bitcoin on BitMEX vs. BTC’s index price, are “still negative.” This suggests longs are not yet overleveraged.
- Bitcoin is trading above the yearly volume-weighted average price.
- BTC is above the 200-day moving average.
- The one-day Ichimoku Cloud has flipped bullish.
Also bullish, the Parabolic Stop-and-Run Reversal indicator just signaled a “buy” for Bitcoin on the weekly chart.
Nunya Bizniz, a chartist in the cryptocurrency space, explained that in the wake of the six times this indicator has appeared in the past five years, Bitcoin saw “substantial upside.” Such was the case at the start of 2019, when just prior to the 25% breakout on April 1st, the PSAR flipped bullish, marking the start of an over 300% rally.
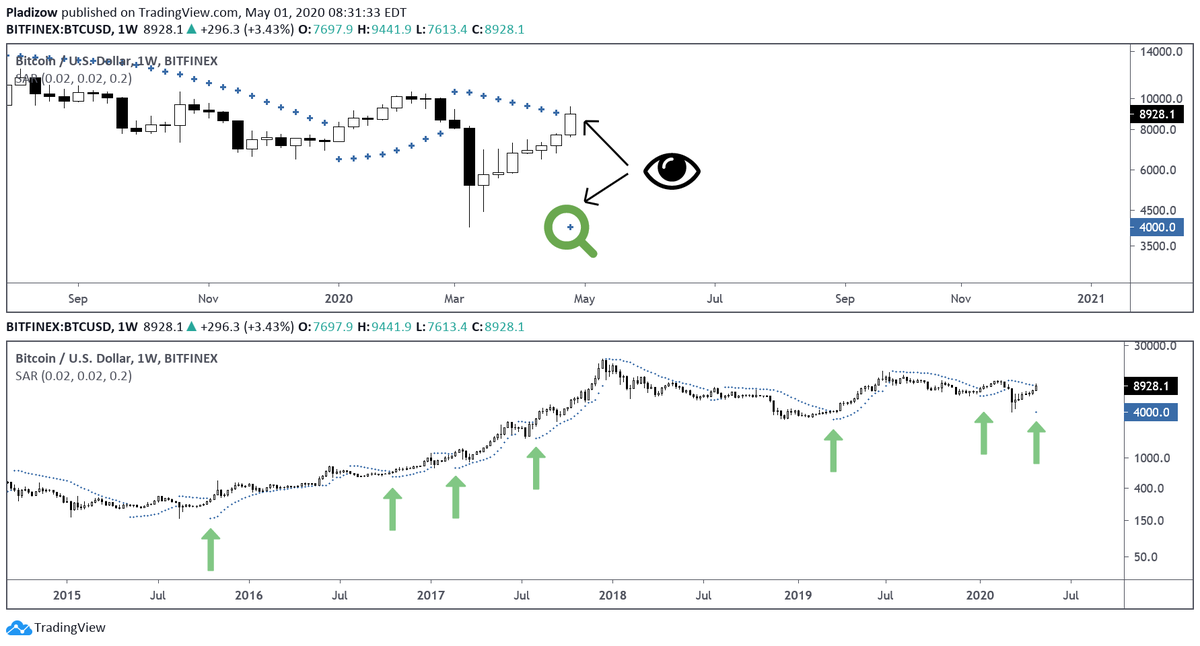
Chart from Nunya Bizniz (@Pladizow on Twitter)
History repeating will see BTC strongly break to the upside yet again in the coming weeks.
In terms of fundamentals, Bitcoin’s block reward halving is a mere 10 days out, estimates suggest. Analysts expect this fundamental event to act as a catalyst for a parabolic surge in the cryptocurrency market.
Photo by jordan Huie on Unsplash