Chainlink is easily the best performing cryptocurrency for the last three years, and this year managed to outperform Bitcoin by over 500%. But the tides have finally turned on the two opposing crypto coins, and it could signal an extended downtrend against the first-ever cryptocurrency for the foreseeable future.
Here are three compelling reasons and charts supporting this theory that investors in the decentralized oracle technology don’t want to hear.
Weekly Momentum Shift Made Clear In Chainlink By Two Reliable Technical Indicators
Chainlink potentially topped out for the time being in both its USD pair and against BTC. With Bitcoin now blasting off and about ready to embark on a new bull run, altcoins, and even DeFi rockstars like LINK are breaking under the pressure.
The leading cryptocurrency by market cap is once again sucking all of the capital out of the rest of the crypto world, and its shows on the LINKBTC trading pair.
Although Chainlink’s run-up has been one for the history books, rising from under $1 to $20 in a single year low to high, it could now be over for the foreseeable future – at least against Bitcoin.
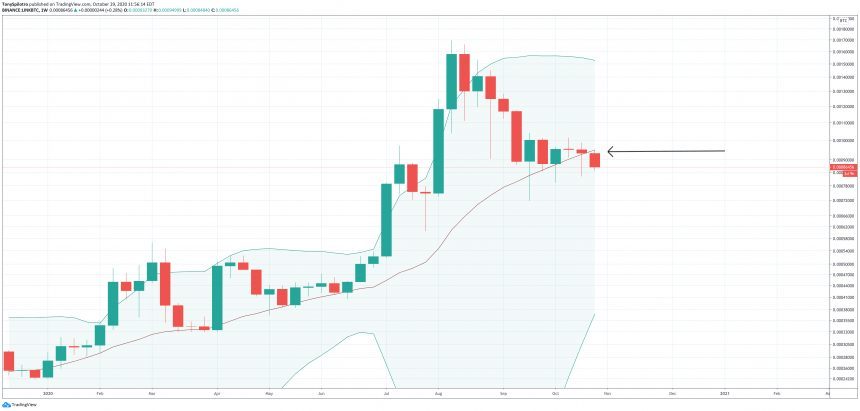
A weekly close below the middle-BB moving average is a negative sign | Source: LINKBTC on TradingView.com
The first signal showing that a Chainlink downtrend is only just starting is a weekly close and failed retest of the middle Bollinger Bands moving average.
Related Reading | Crushing Bitcoin Dominance Could Decimate Altcoins Through Q1 2021
Next, is the Average Directional Index, which comes equipped with two Directional Movement Index lines. When these lines crossover, it signals a trend change for bullish to bearish or vice versa. As the ADX itself falls to indicate the prevailing trend has ended, and bears can be seen taking over from bulls with a crossover of the DMI.
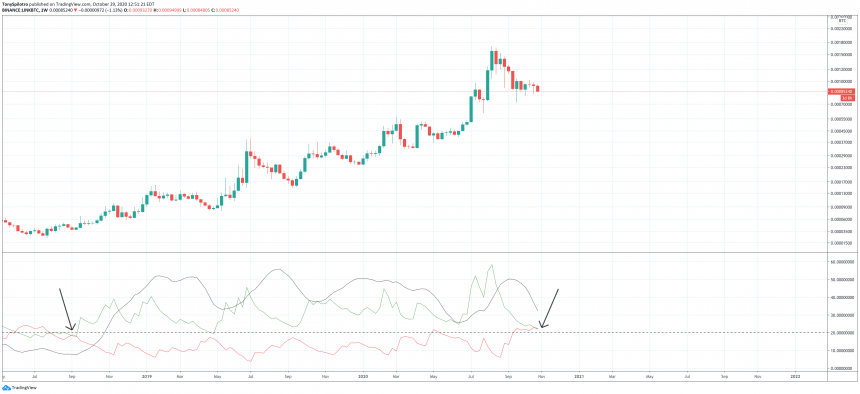
Bears have taken over on the Chainlink pair against Bitcoin | Source: LINKBTC on TradingView.com
LINKBTC Downfall Projected By Data, Ethereum Provides Blueprint For 80% Breakdown
Perhaps the most damning evidence that things are about to get a lot worse for the LINKBTC trading pair, is due to the altcoin losing its parabolic curve.
Comparing the previous once hottest altcoin, Ethereum, which peaked against Bitcoin ahead of the crypto bubble top, the price action in LINKBTC closely matches.
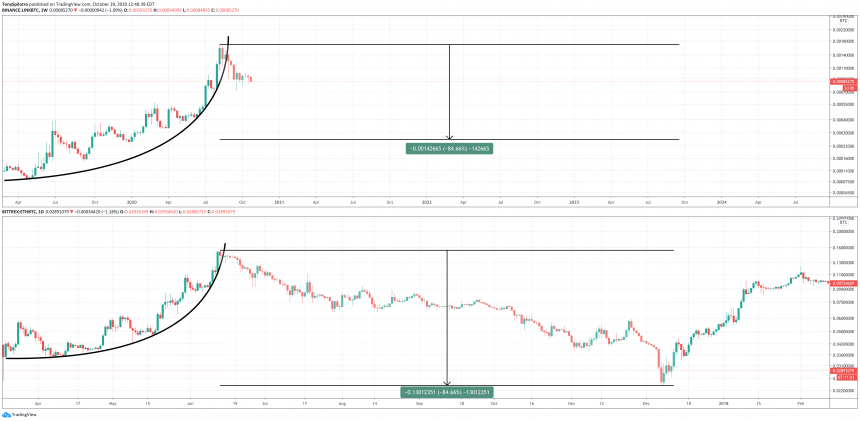
Chainlink rally closely mimics Ethereum parabola and subsequent breakdown | Source: ETHBTC on TradingView.com
When assets lose their parabolic advance, data shows that they can plummet by as much as 80% or more. This data is how Peter Brandt called Bitcoin’s bottom of $3,200 a year in advance.
Related Reading | Bitcoin RSI Moves Into Bull Market Territory, Here’s What Happens Next
It also exactly matches with Ethereum’s decline against BTC on the ETHBTC pair, which again resembles about where Chainlink is before Ethereum’s fall began to accelerate.
Ethereum’s never been able to catch up to Bitcoin fully since.
Featured image from Deposit Photos, Charts from TradingView.com