
Bitcoin price is once again flirting with resistance above $10,000 but has yet to penetrate and hold above the key level. This latest visit has resulted in a lower high.
Unless the cryptocurrency can get through and set a new local peak, the asset is at risk of setting a new lower low. It could also put the asset at risk of setting a new bear market bottom, even despite what market sentiment may suggest.
Sentiment Says Bull Market Is Here, But Has Bitcoin Really Bottomed?
All markets are cyclical and go through periods of prosperity and exuberance that get brought back down to reality through decline and destruction.
It’s been nearly four full years since Bitcoin peaked at $20,000. The crypto bubble that burst is now a distant, yet painful memory. The asset class, however, is still full of promise and potential, and positive growth is just days away at this point.
Related Reading | This Unique Perspective on Bitcoin Charting Makes Bull Breakout Clear As Day
Chartered market technicians claim technicals point to a new uptrend forming in an asset that’s primarily been bullish throughout its existence. A breakout at first glance appears to be clear as day.
Technical analysts utilize tools and indicators that assist them with understanding where assets are in such a cycle. One such tool, designed to measure the strength of a trend, could indicate that Bitcoin hasn’t yet bottomed.
And if the asset hasn’t yet bottomed, when might this happen, and how low could prices fall?
Average Directional Index on BTCUSD Gives Ominous Bear Signal
It seems impossible to believe, but indicators supply data without bias. The Average Directional Index is one of those tools, designed by J. Welles Wilder to measure trend strength.
Wilder also developed other popular technical analysis tools, such as the Relative Strength Index and the Parabolic SAR.
The ADX also consists of two directional movement indicators. When the two indicators cross, it signals if the trend is bearish or bullish. The ADX itself then measures how strong a trend is.
Related Reading | Why Bitcoin Risks a 40% Correction After its Retest of Bollinger Band Mid-Line
Readings over 20 suggest a trend is picking up in strength, and the higher the number goes, the stronger the trend. High readings could suggest a trend is reversing, and when readings are at extreme lows, there’s next to no trend at all.
On monthly timeframes on BTCUSD charts, the ADX is giving a potentially frightening signal. According to the tool, Bitcoin may not have bottomed yet.
BTCUSD Average Directional Index Monthly | Source: TradingView
Compared to the previous bear to bull cycle, the ADX hasn’t yet fallen below 20, suggesting the previous trend hasn’t fully ended. Adding more credence to the theory, the two directional indicators have yet to cross bearish during this downtrend.
While this could simply indicate Bitcoin is just too bullish for the indicators to cross bearish, comparisons to the past show otherwise.
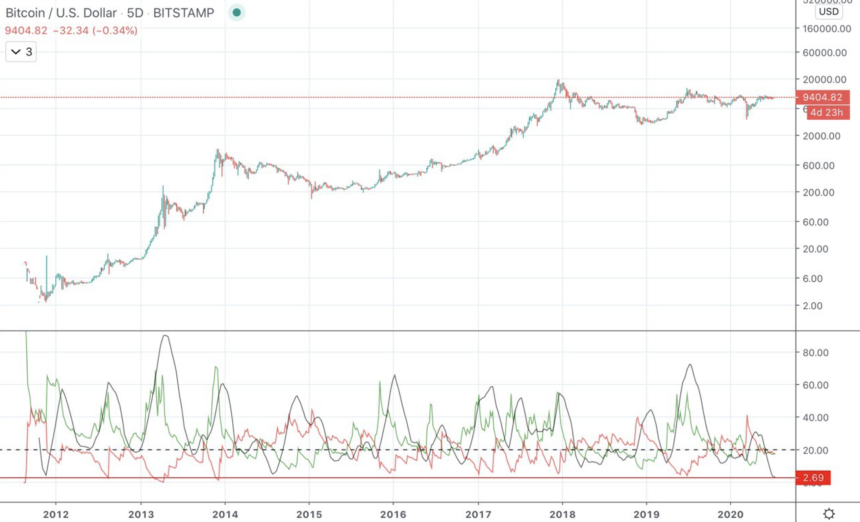
BTCUSD Average Directional Index 5-Day | Source: TradingView
Switching to yet another high timeframe on BTCUSD, the 5-Day chart on the ADX shows that the trend is currently at the lowest strength ever recorded in the cryptocurrency.
If that’s the case, a short-term trend direction could be chosen soon. If the direction is down on the 5-Day, the ominous Monthly BTCUSD signal could confirm. If the trend direction is up, Bitcoin may never cross bearish on the ADX, and the trend may pick up in strength from here.