Bitcoin (BTC) price has had a tremendous month as the price rallied from $10,500 to $13,800. However, in recent days, momentum is slowing amid rising coronavirus fears. Bitcoin’s price dropped from $13,800 to $12,900 on Oct. 28, making the recent breakout a fakeout.
Alongside a correction on the cryptomarkets, the equity and commodity markets also showed weakness. As the S&P retraced 4% on Wednesday, Silver also corrected 6%. The only asset doing relatively well was the U.S. Dollar Currency Index (DXY). In other words, investors are flying towards the USD for safety once again.
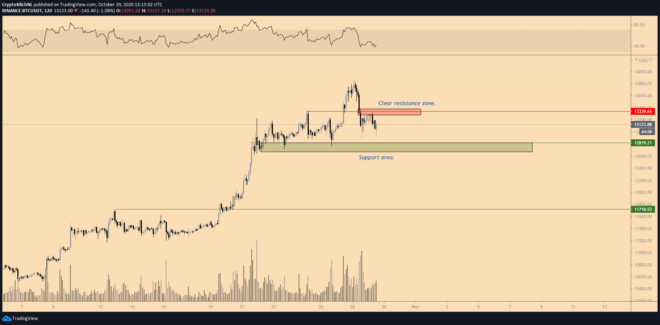
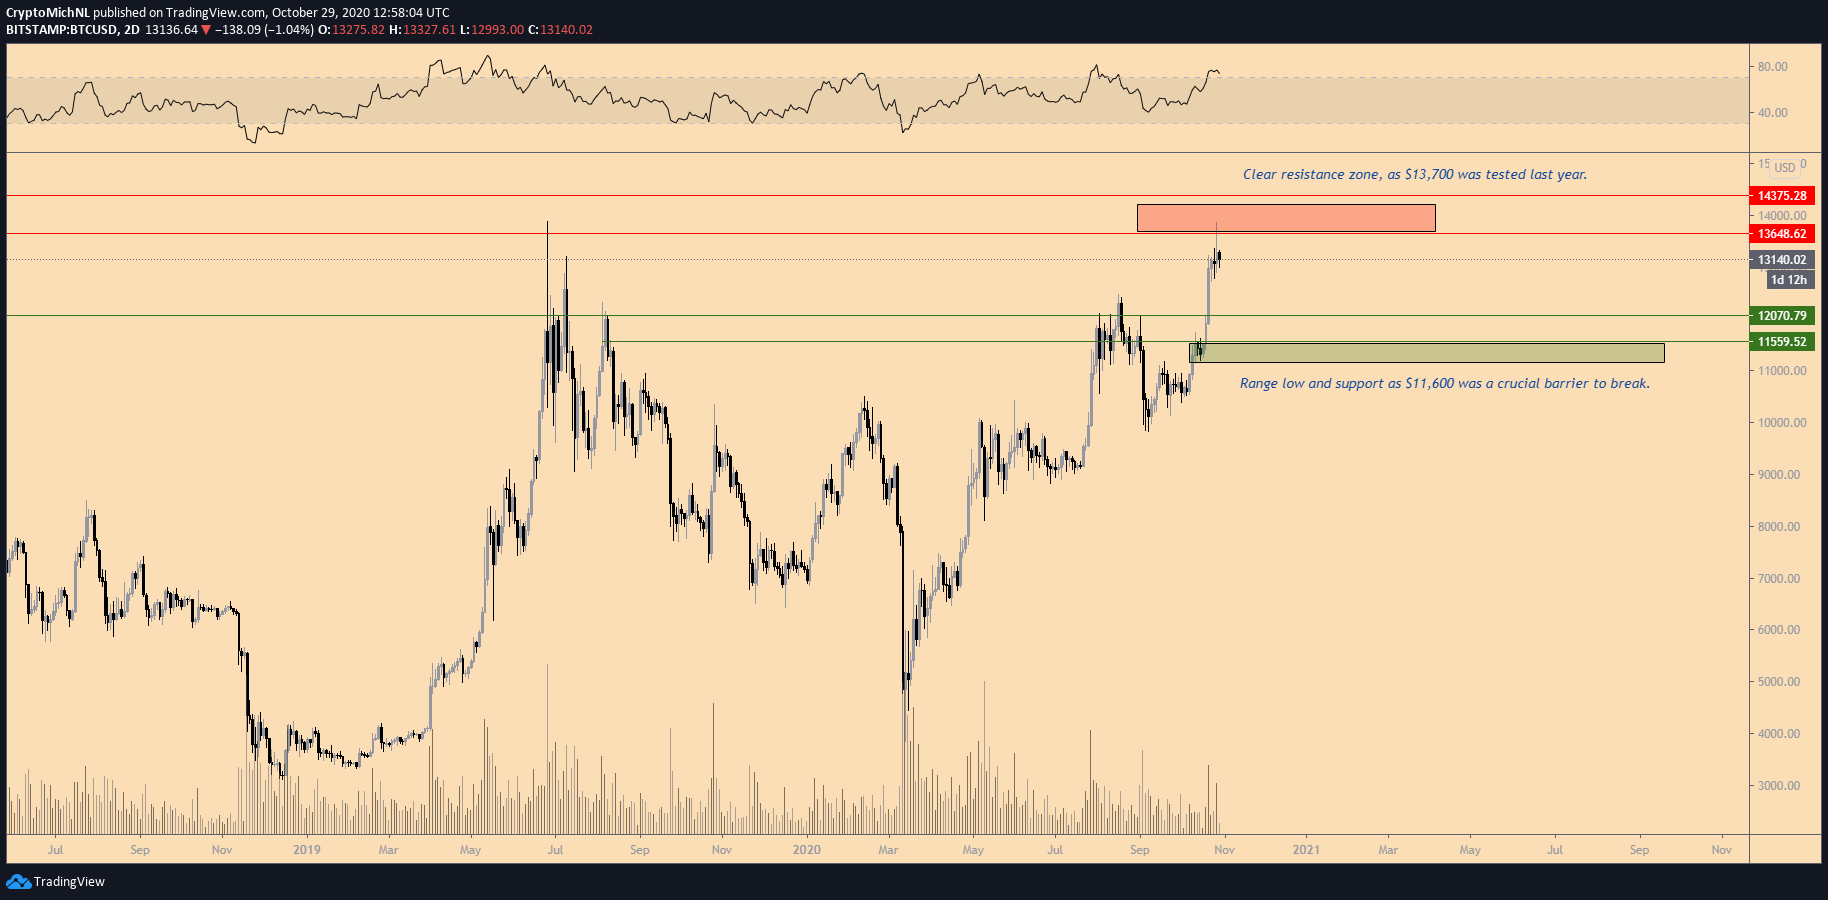
The $13,500-14,000 area confirming resistance for Bitcoin
BTC/USD 2-day chart. Source: TradingView
The 2-day chart shows an apparent resistance at the $13,500-14,000 area as a rejection is seen in this area. The $13,500-14,000 area is the final big hurdle until a potential new all-time high can be hit. Many investors and traders are eying this area as crucial.
The chart also shows a clear support zone ready to be tested in the coming period. This zone is marked between $11,600-12,200. If that area holds for support, new range-bound construction can be established to start a healthy accumulation period.
DXY bouncing upwards, causing BTC price to drop
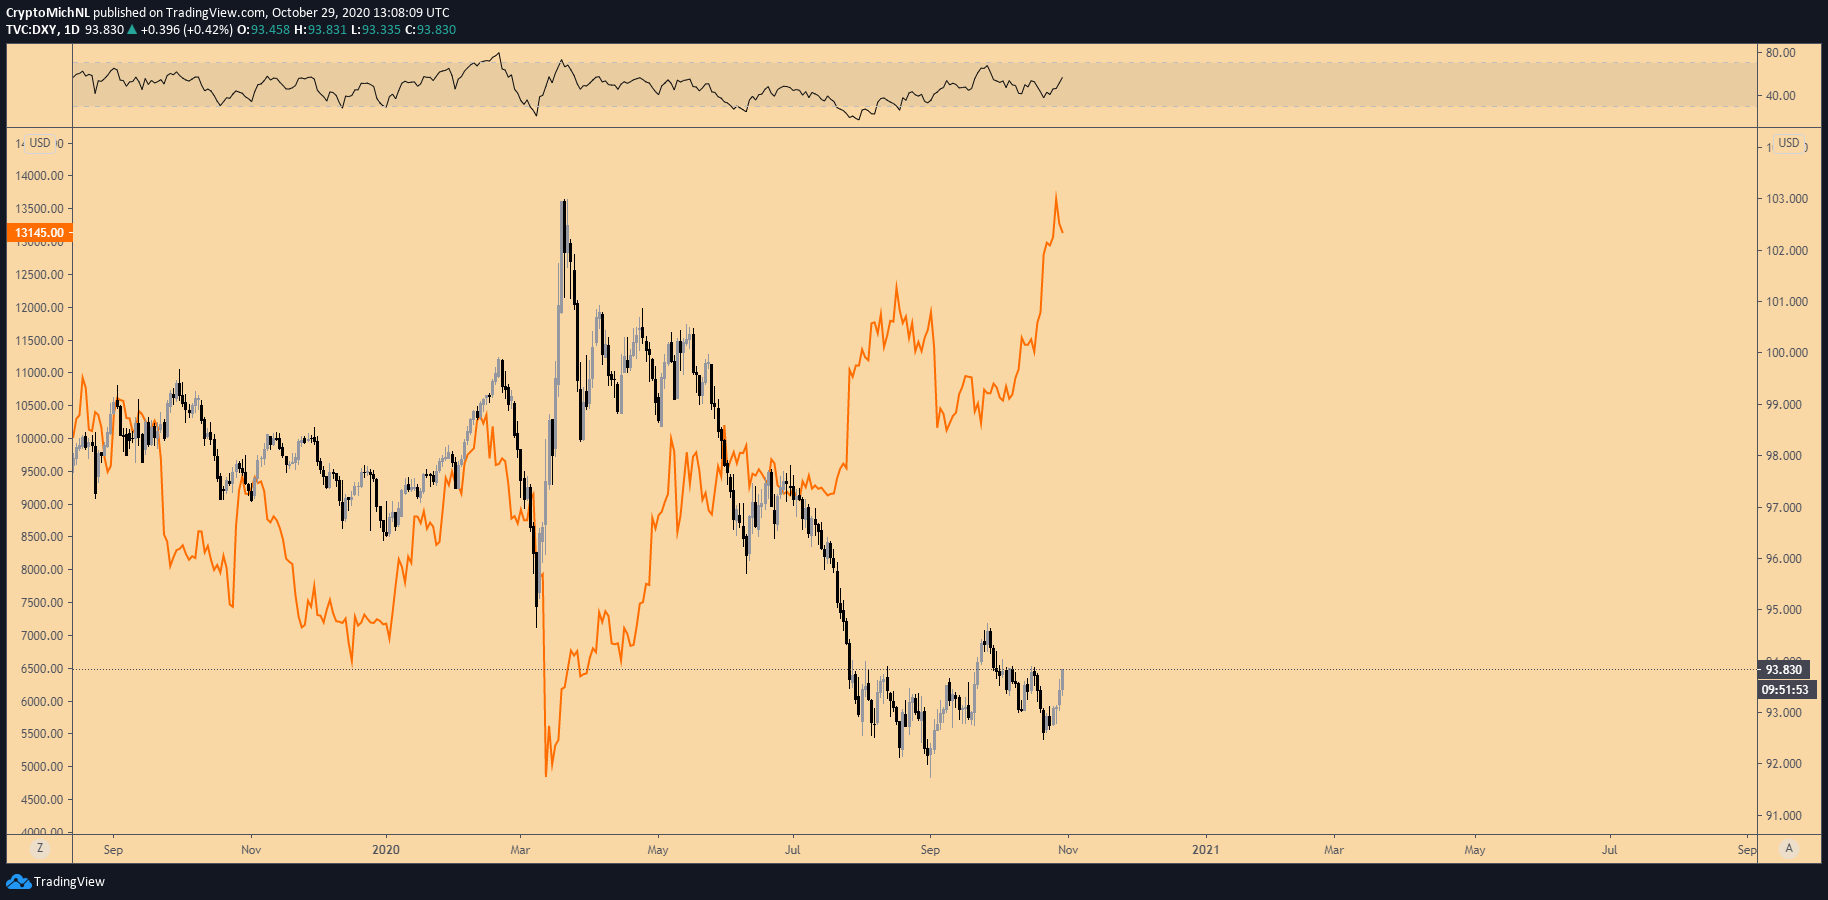
U.S. Dollar Currency Index 1-day chart. Source: TradingView
As the fear surrounding potential full lockdowns returning across Europe, the flight towards safety is also starting up.
The first wave was there in March 2020, when the flight toward the U.S. Dollar was seen as markets crashed. Through that, the U.S. Dollar Currency Index (DXY) found a bottom and bounced upward from the 92.50 points level. Currently, it’s close to 94 points, through which the recent bounce of the DXY index triggered weakness across the other markets.
Bitcoin retraced heavily in recent days, but even Silver showed a 6% correction in just a day.
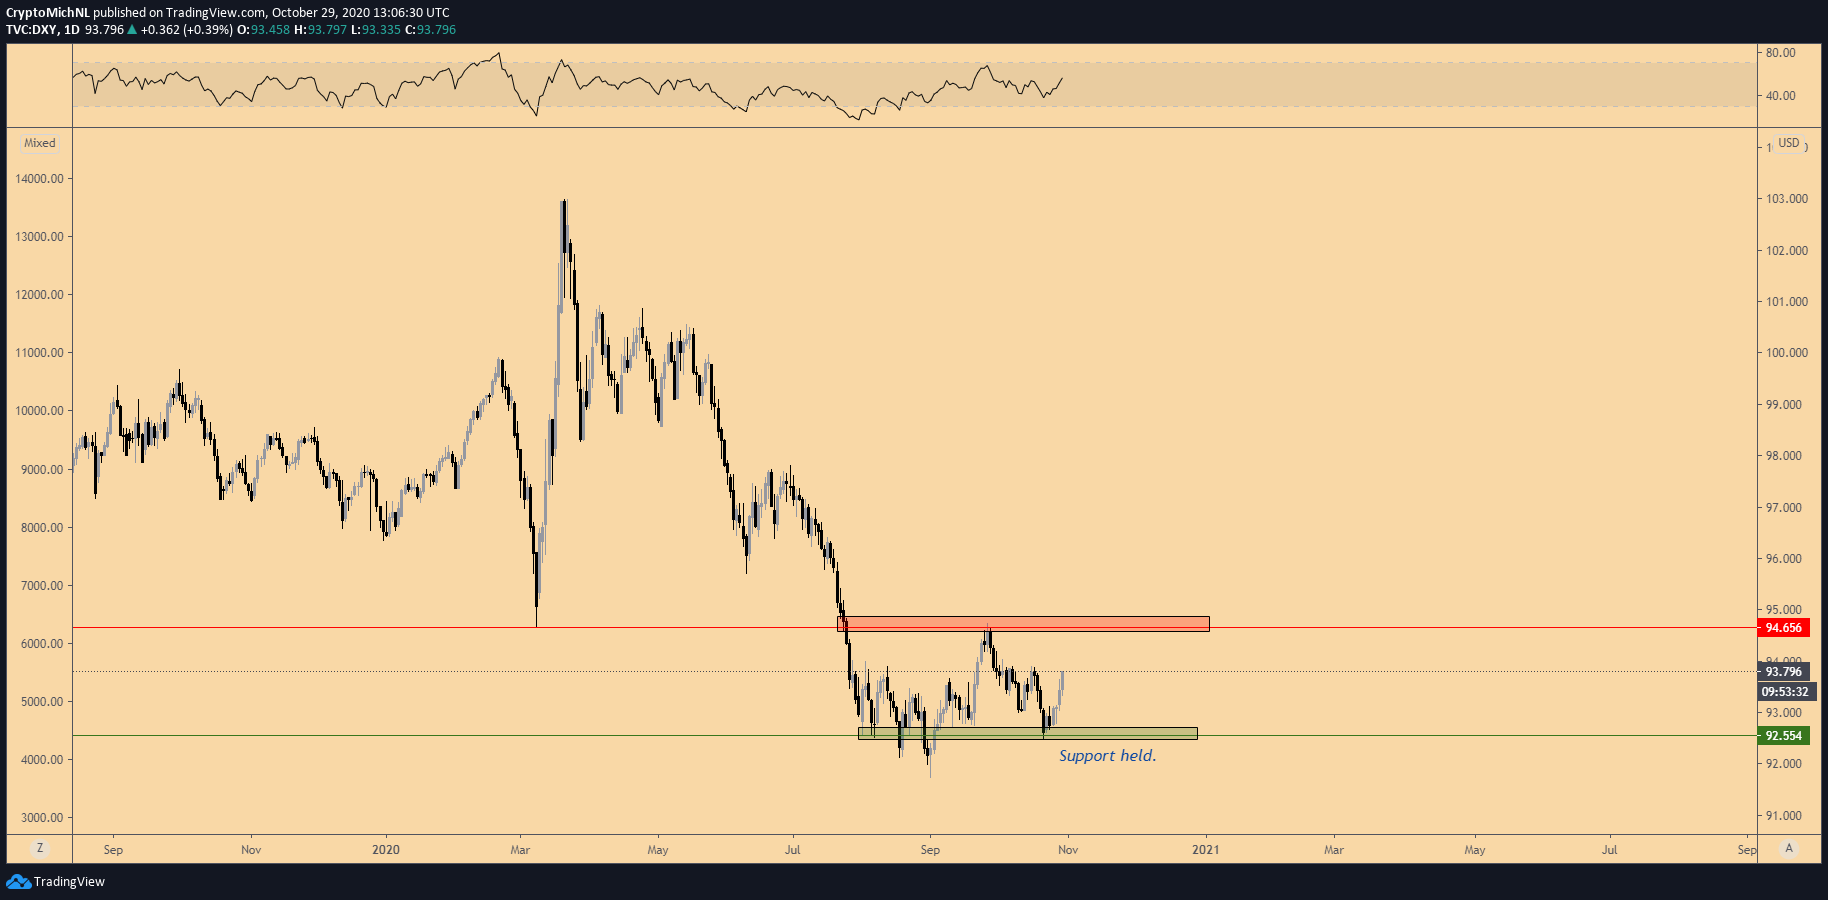
U.S. Dollar Currency Index 1-day chart. Source: TradingView
As the data shows, the correlation between Bitcoin and the DXY index became inverse since the March crash. This is also similar to the movements of Gold.
But what can be derived from this data is that the likelihood of further corrections for Bitcoin are increasing amid the legacy markets’ weakness and social unrest surrounding the potential lockdowns.
A correction wouldn’t necessarily be unhealthy for the Bitcoin market at this point as that may lead to further accumulation.
The majority of the investors definitely want to see a straight line towards $200,000, but that’s simply not happening. At best, Bitcoin is at the start of a new cycle, through which the boring sideways part will keep recurring. Once all levels are tested, parabolic movements can occur in price discovery.
Bulls must reclaim $13.3K
BTC/USDT 2-hour chart. Source: TradingView
A familiar concept is a breakout above the previous resistance for liquidity. After this, an immediate drop back into the range occurs. This is called a fakeout and is often seen in the markets to take liquidity.
As the chart shows, a clear resistance zone is established at $13,250-13,400 and should be broken to sustain further upward momentum. If the resistance zone can’t be cleared, the downside becomes more likely.
The levels beneath the current prices are $12,700-12,850 and $11,600-11,800 as higher timeframe zones to watch for potential support.
The latter “hell’s candle” scenario is only expected if the support zone between $12,700-12,850 is lost. However, such a drop would warrant massive selloffs across all crypto markets with altcoins taking the biggest losses from such a correction on Bitcoin.
The views and opinions expressed here are solely those of the author and do not necessarily reflect the views of Cointelegraph. Every investment and trading move involves risk. You should conduct your own research when making a decision.